
This post is part of a series about creating a Selenium WebDriver test framework.
HTTP Archive (HAR) files are a standard JSON formatted log of a browser’s interaction with an external web application.
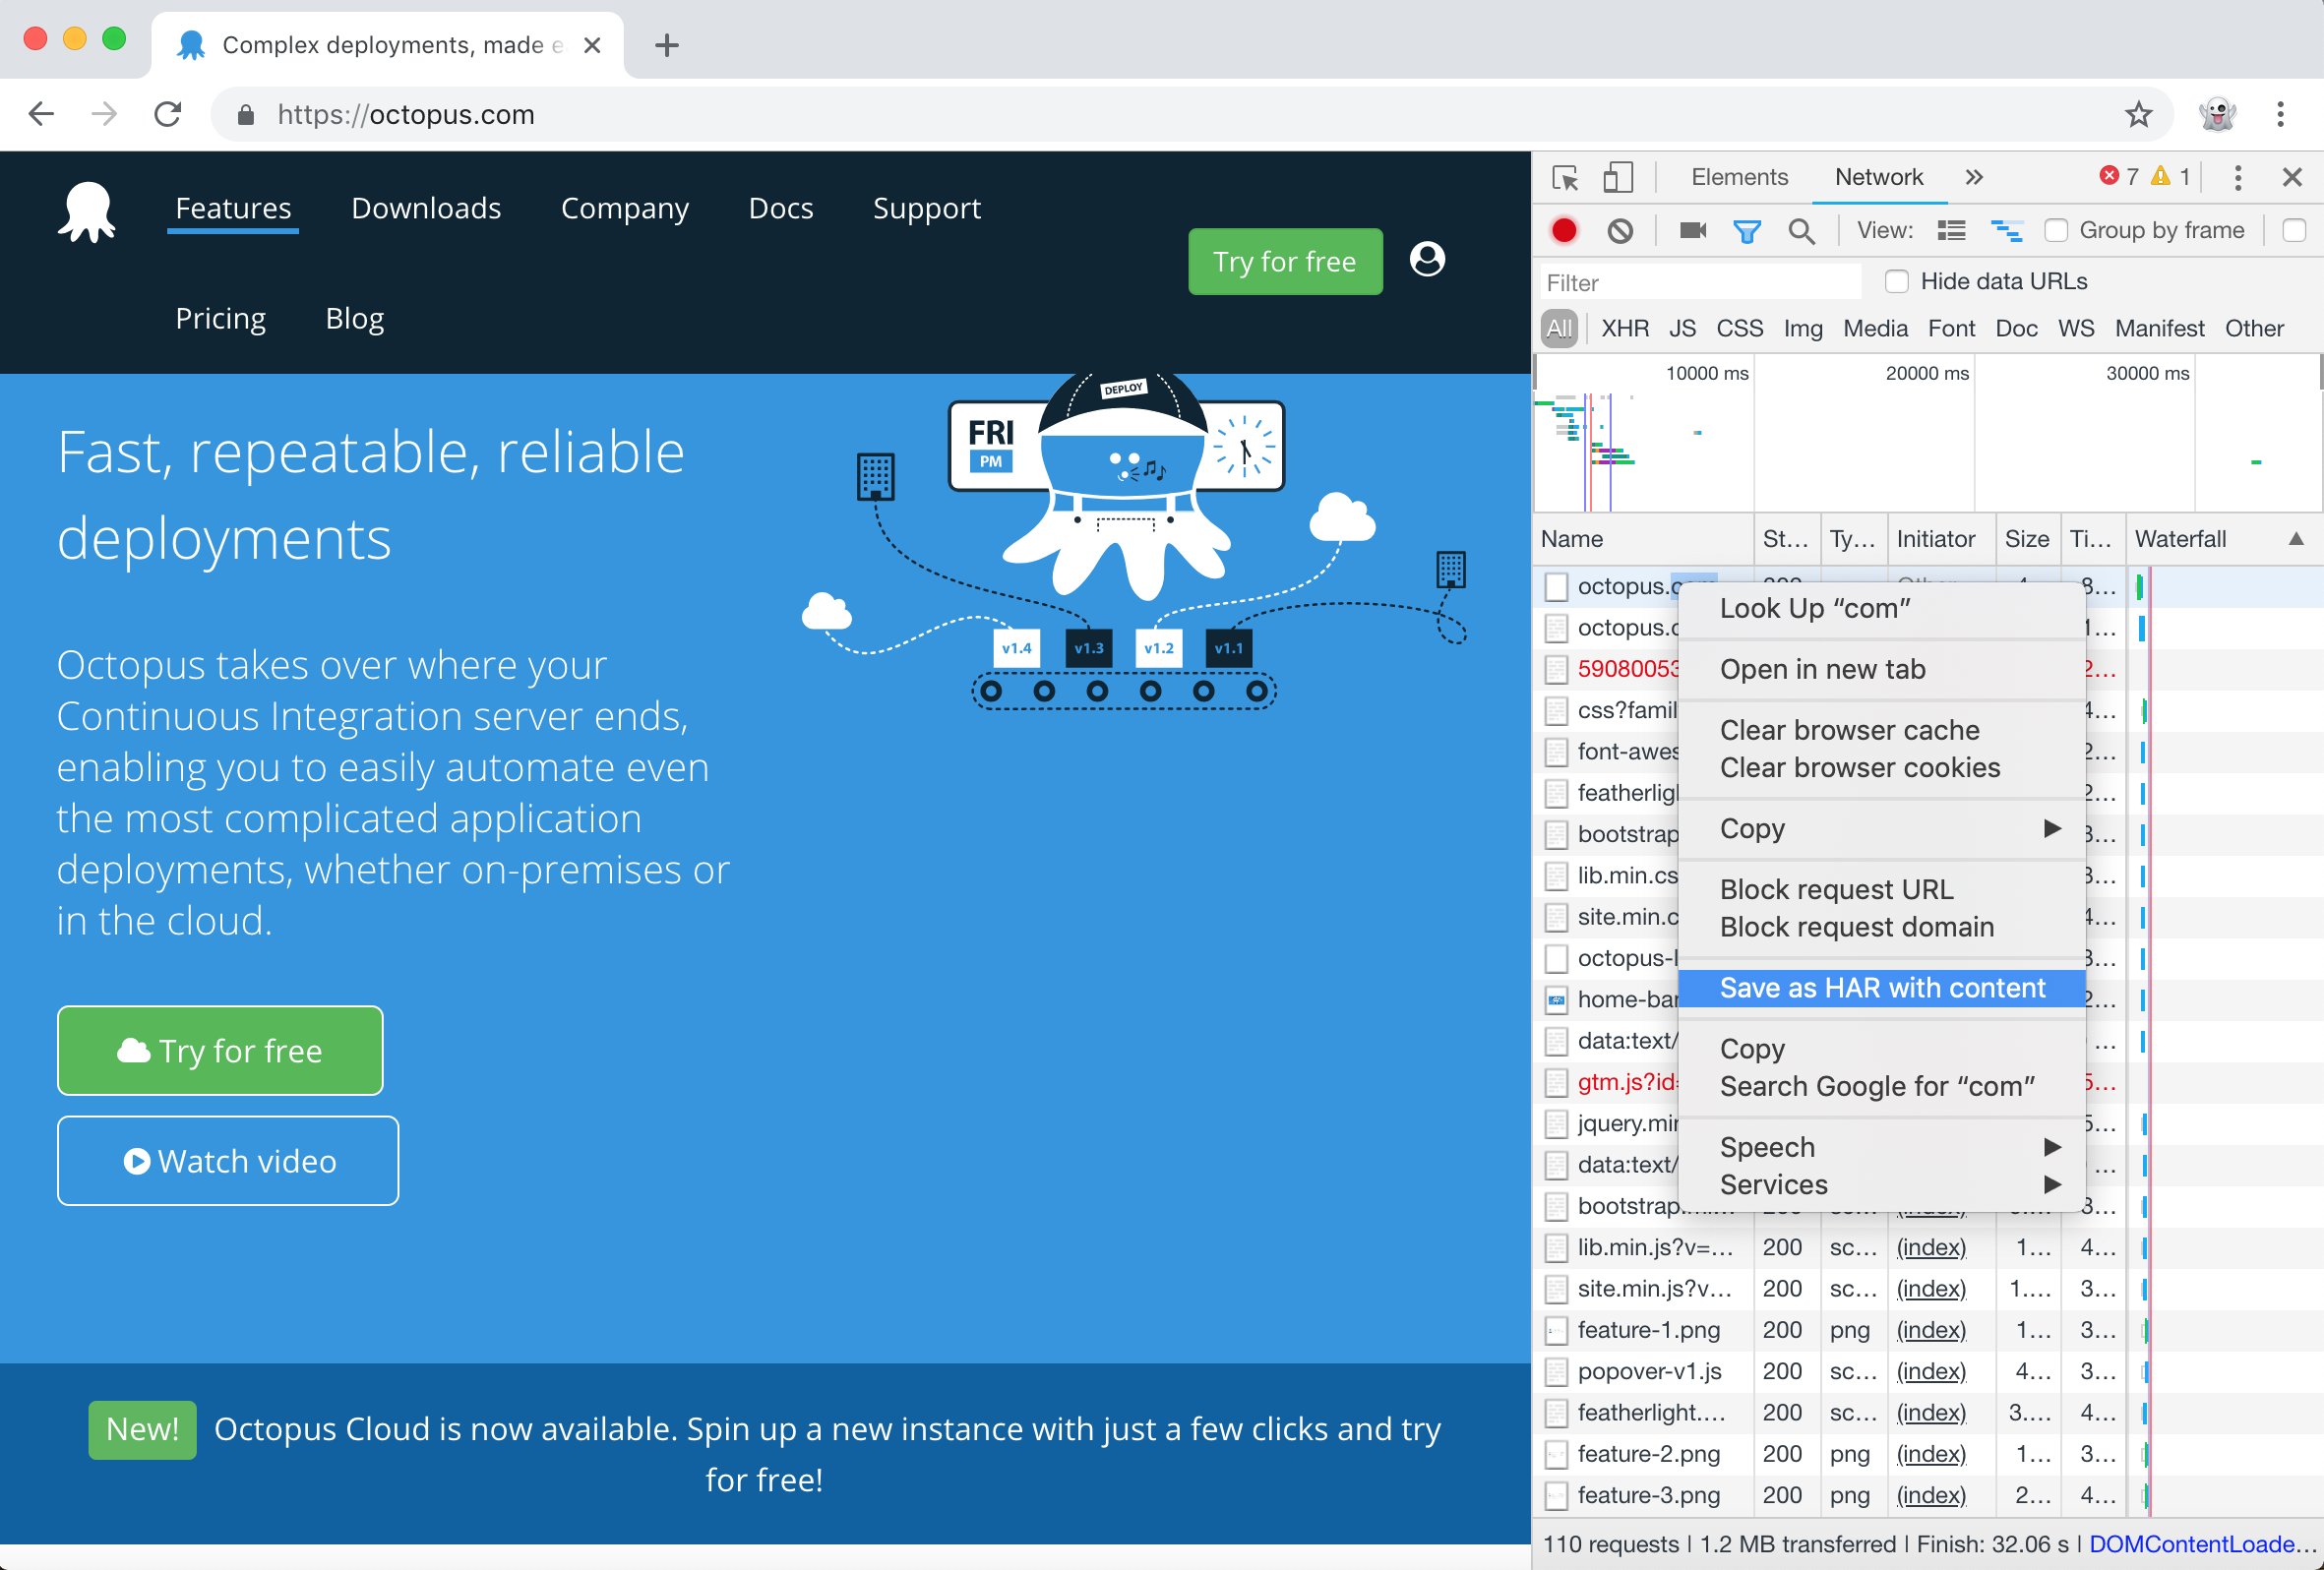
You can generate a HAR file by opening the Chrome developer tools, clicking the Network tab, opening a web site, and then right clicking in the list of network calls and selecting Save as HAR with content.
This will generate a HAR file that contains the details of all the network calls captured by the developer tools.
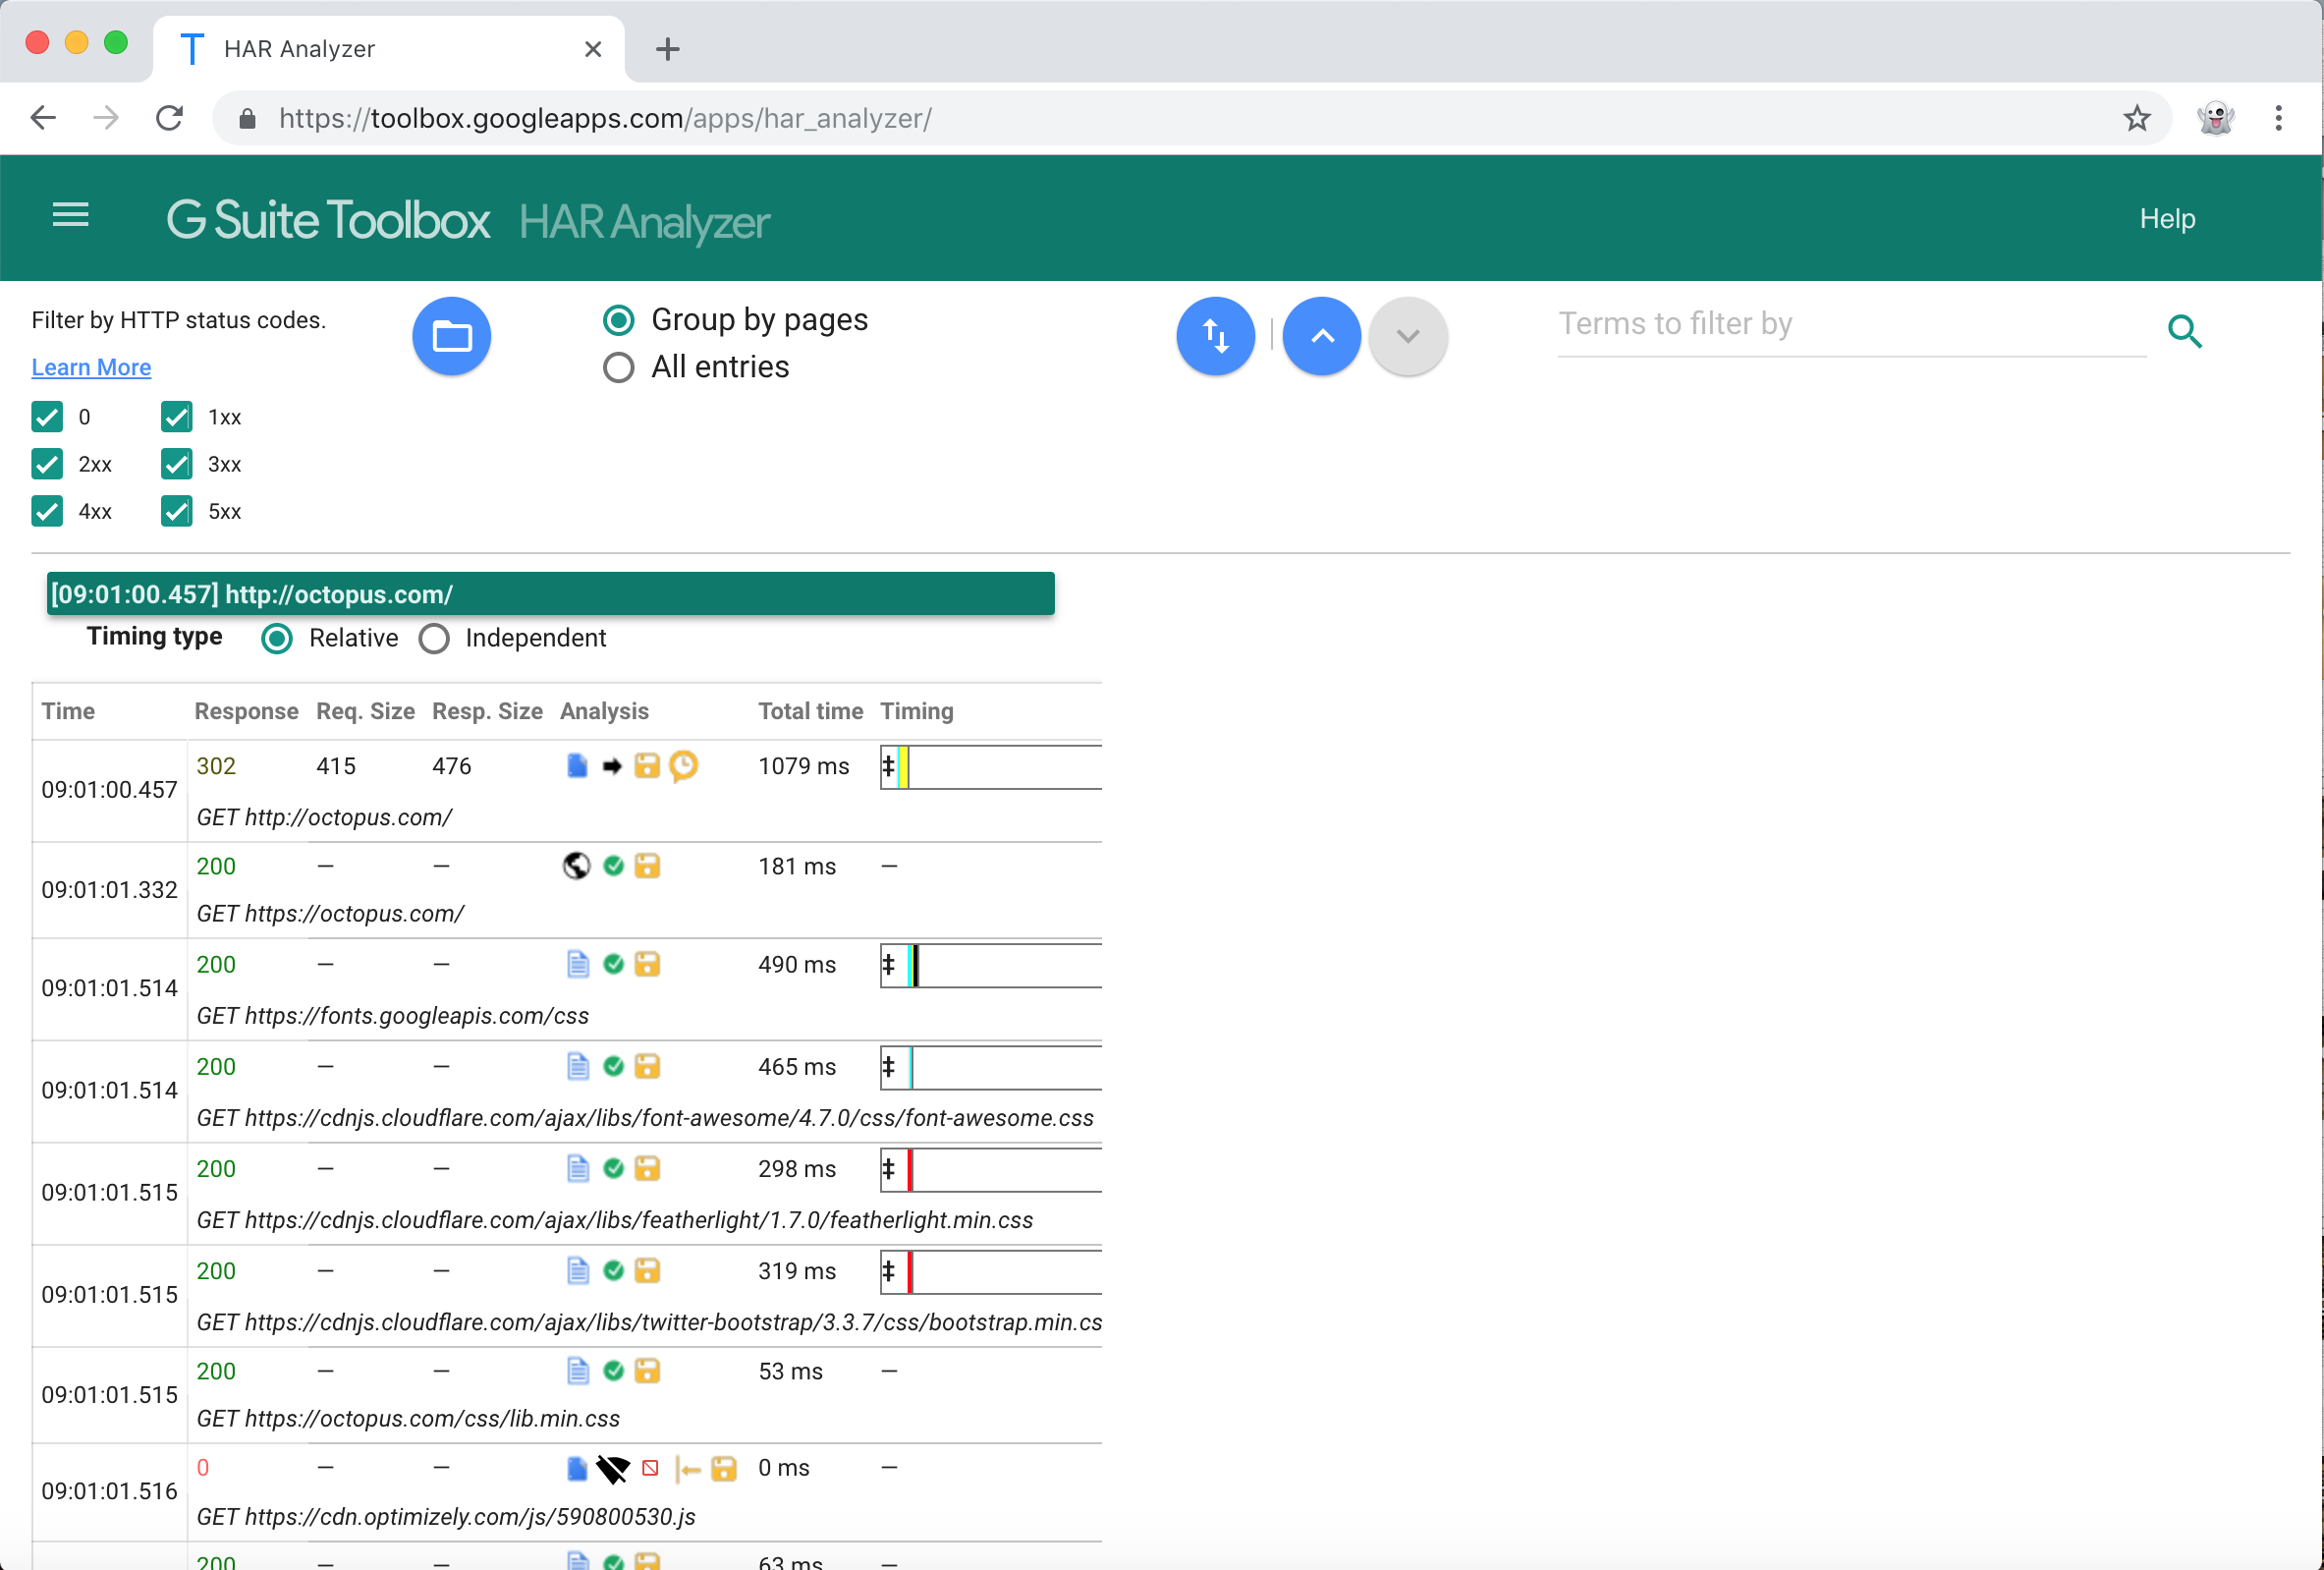
Because HAR files have an open format, there are a number of tools online you can use to inspect their contents. One such tool is the HAR Analyzer. This tool lets you upload a HAR file and then filter by HTTP response code, inspect the content associated with a request, and view the timing of each network call. This kind of information is invaluable when debugging an error with a web application or to understand how well the site is responding.
One useful feature in BrowserMob is the ability to generate HAR files based on the network requests that pass through it.
To allow tests to capture HAR files, we will add two methods to the AutomatedBrowser interface:
void captureHarFile();

void saveHarFile(String file);
The captureHarFile() method is used to instruct BrowserMob to begin capturing network traffic, while the saveHarFile() method will take any captured traffic and save it to the specified file.
Default methods are then added to AutomatedBrowserBase:
@Override
public void captureHarFile() {
  if (getAutomatedBrowser() != null) {
    getAutomatedBrowser().captureHarFile();
  }
}

@Override
public void saveHarFile(final String file) {
  if (getAutomatedBrowser() != null) {
    getAutomatedBrowser().saveHarFile(file);
  }
}
And the methods are implemented in the BrowserMobDecorator class.
To start capturing network traffic, we make a call to newHar() on the BrowserMob proxy object:
@Override
public void captureHarFile() {
  proxy.newHar();
}
To save the captured traffic by calling getHar().writeTo():
@Override
public void saveHarFile(final String file) {
  try {
    proxy.getHar().writeTo(new File(file));
  } catch (final IOException ex) {
    throw new SaveException(ex);
  }
}
The checked exception IOException is caught and re-thrown as the unchecked exception SaveException. This allows us to match the interface method signature, which does not specify any checked exceptions.
Here is the code for SaveException. It extends the RuntimeException class, meaning it is an unchecked exception:
package com.octopus.exceptions;

public class SaveException extends RuntimeException {

  public SaveException() {

  }

  public SaveException(final String message) {
    super(message);
  }

  public SaveException(final Throwable cause) {
    super(cause);
  }

  public SaveException(final String message, final Throwable cause) {
    super(message, cause);
  }
}
Now, all that is left is to use these methods as part of a test:
@Test
public void captureHarFile() throws URISyntaxException {
final AutomatedBrowser automatedBrowser =
  AUTOMATED_BROWSER_FACTORY.getAutomatedBrowser("Chrome");

  try {
    automatedBrowser.init();
    automatedBrowser.captureHarFile();
    automatedBrowser.goTo("https://octopus.com/");
  } finally {
    try {
      automatedBrowser.saveHarFile("test.har");
    } finally {
      automatedBrowser.destroy();
    }
  }
}
Here we made a call to automatedBrowser.captureHarFile() before we opened the web page. This ensures we capture all network traffic as part of this test.
In the finally block we nest an additional try/finally block. Inside the nested try block we call automatedBrowser.saveHarFile("test.har"), which will write any captured traffic to the file test.har. This call is made in the finally block because we want to save this network traffic even if the test fails. The HAR file will often contain information that can be used to debug a failed test, so we want to make sure we save this file regardless of an errors during the tests.
Inside the nested finally block, we then call automatedBrowser.destroy(). Because the call to destroy() frees resources, we need to ensure it runs if the test fails and if the attempt to save the HAR file fails. Nesting try/finally blocks in this way guarantees that the destroy() method is called regardless of any other failure.
The resulting test.har file captures the network traffic made as a result to opening https://octopus.com/. This file can then be reviewed with tools like the HAR Analyzer to quickly identify any failed requests (i.e. any HTTP response codes in the 4xx or 5xx range), as well as providing a visual timeline of the calls. This information can be invaluable for debugging errors with web applications and understanding performance bottlenecks.
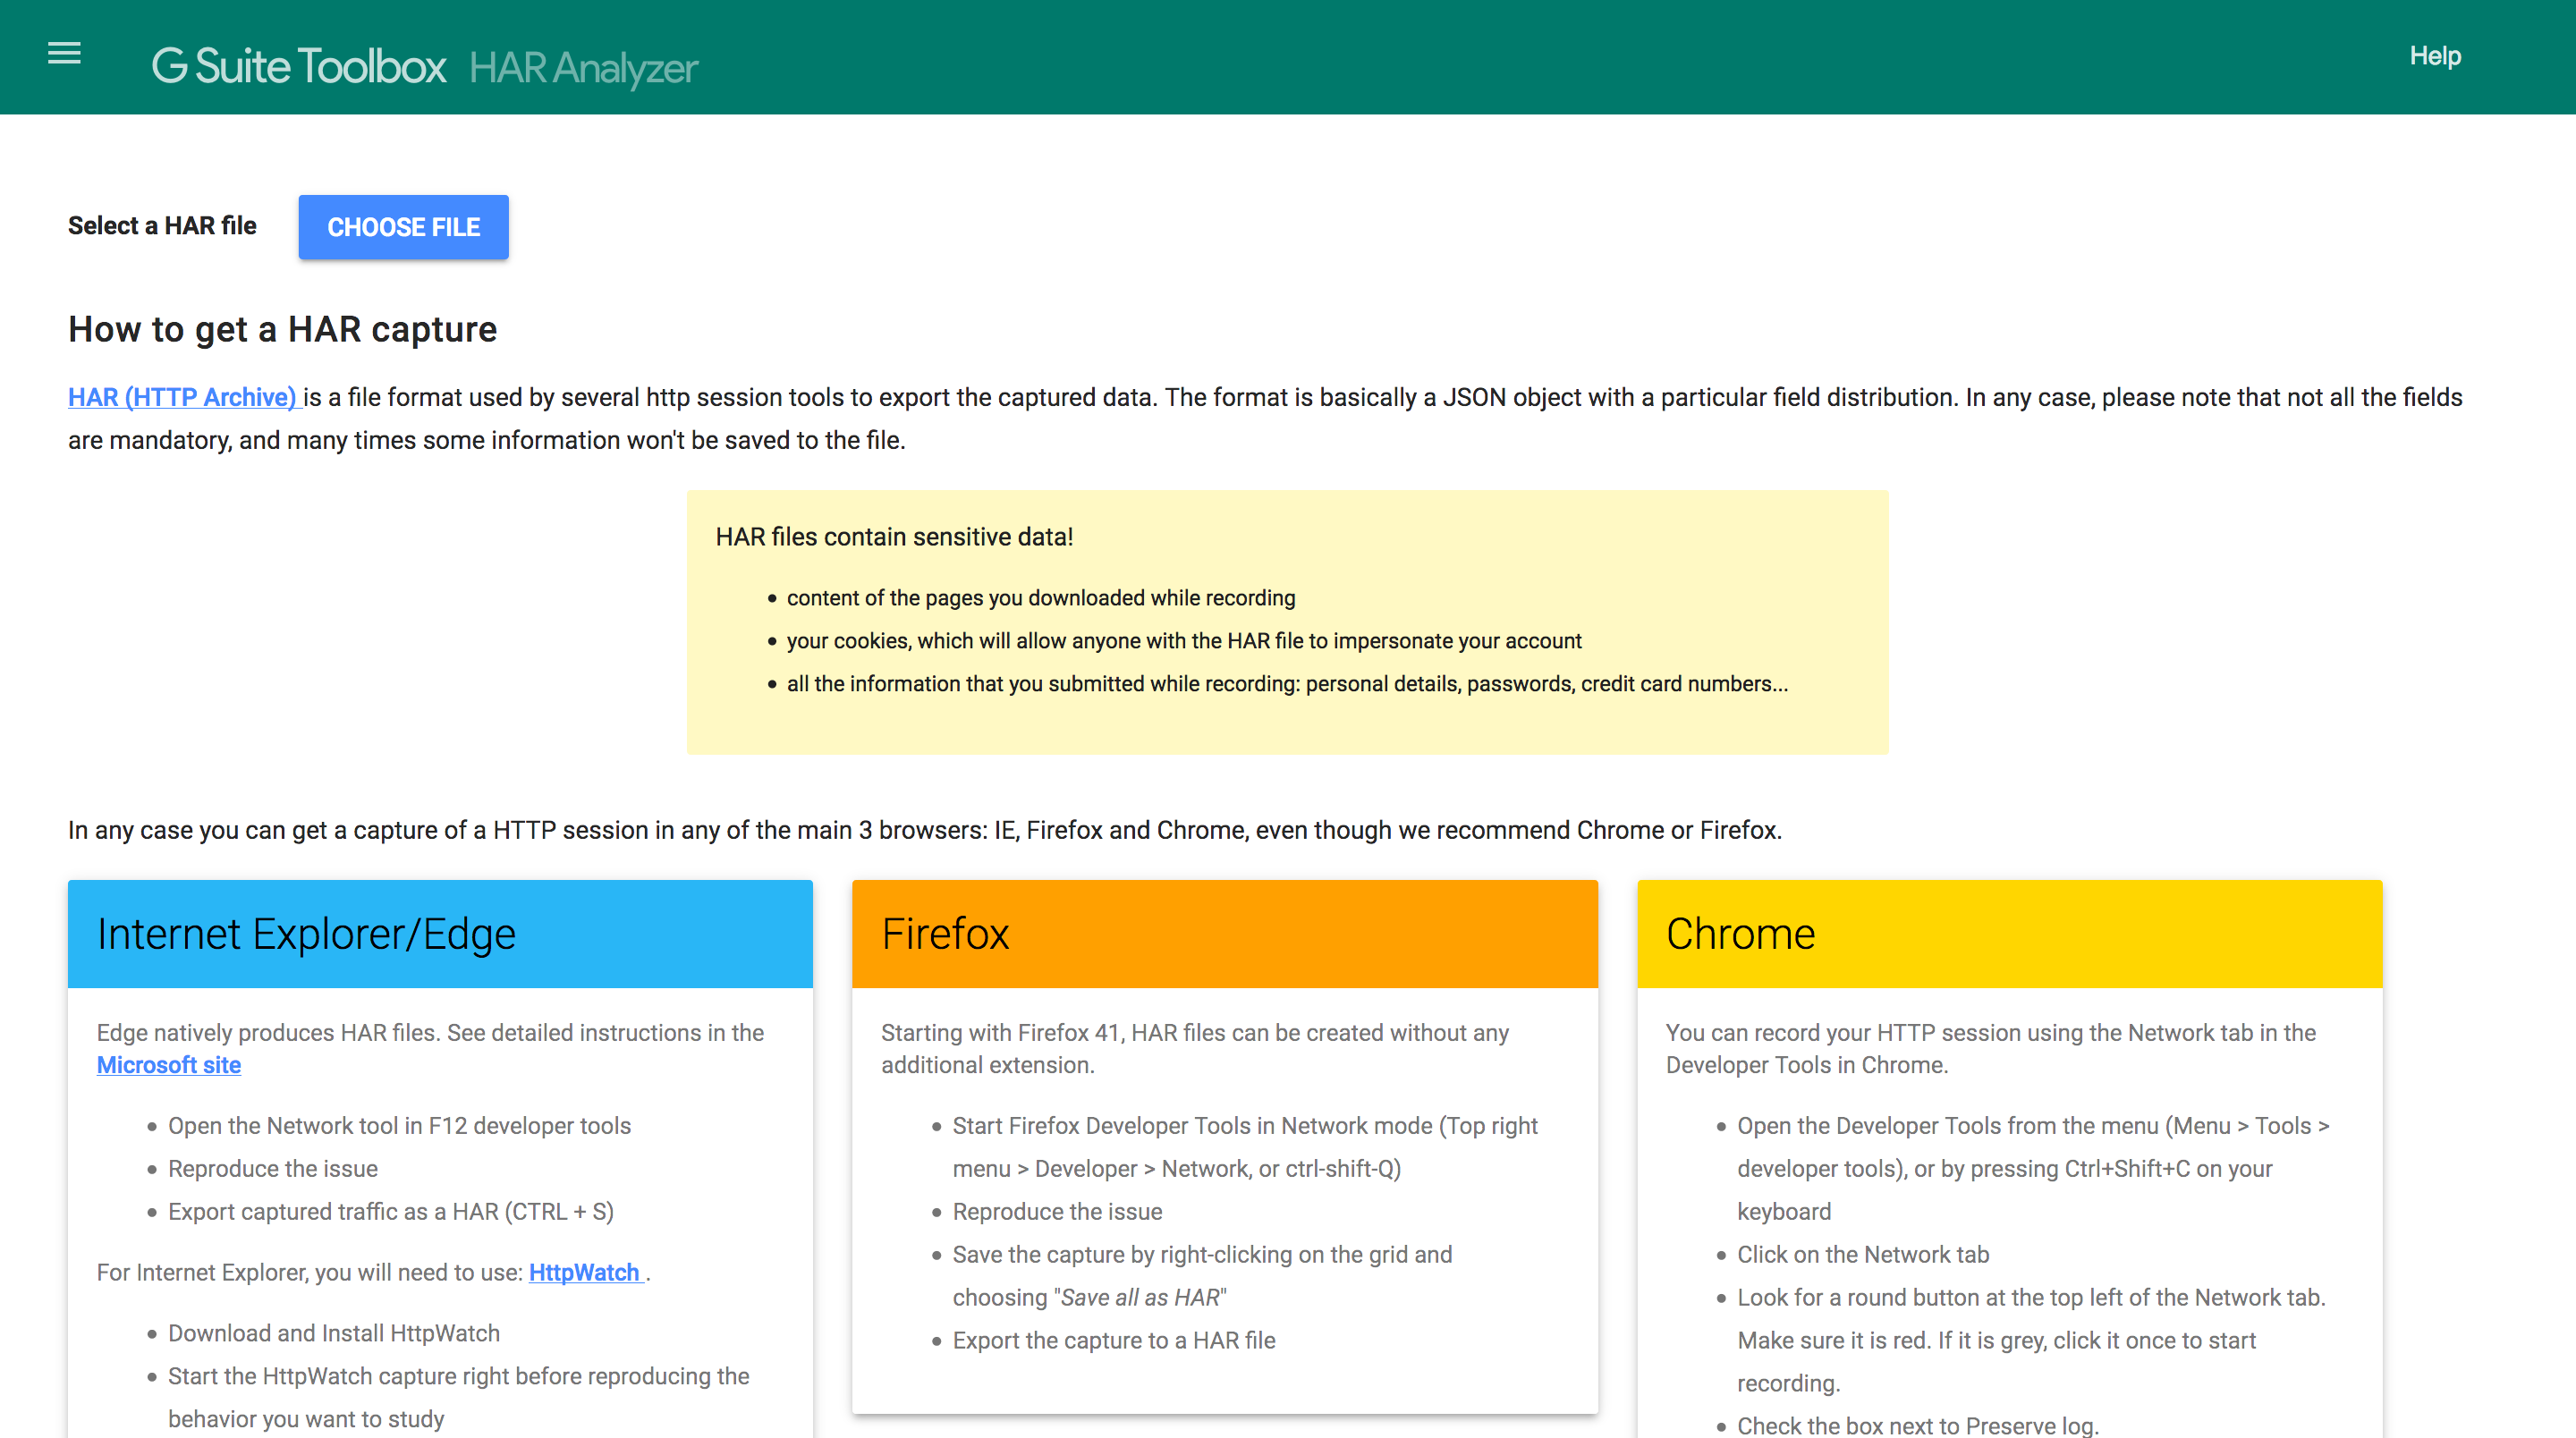
To open file the with HAR Analyzer, go to
https://toolbox.googleapps.com/apps/har_analyzer/ and click the CHOOSE FILE button.
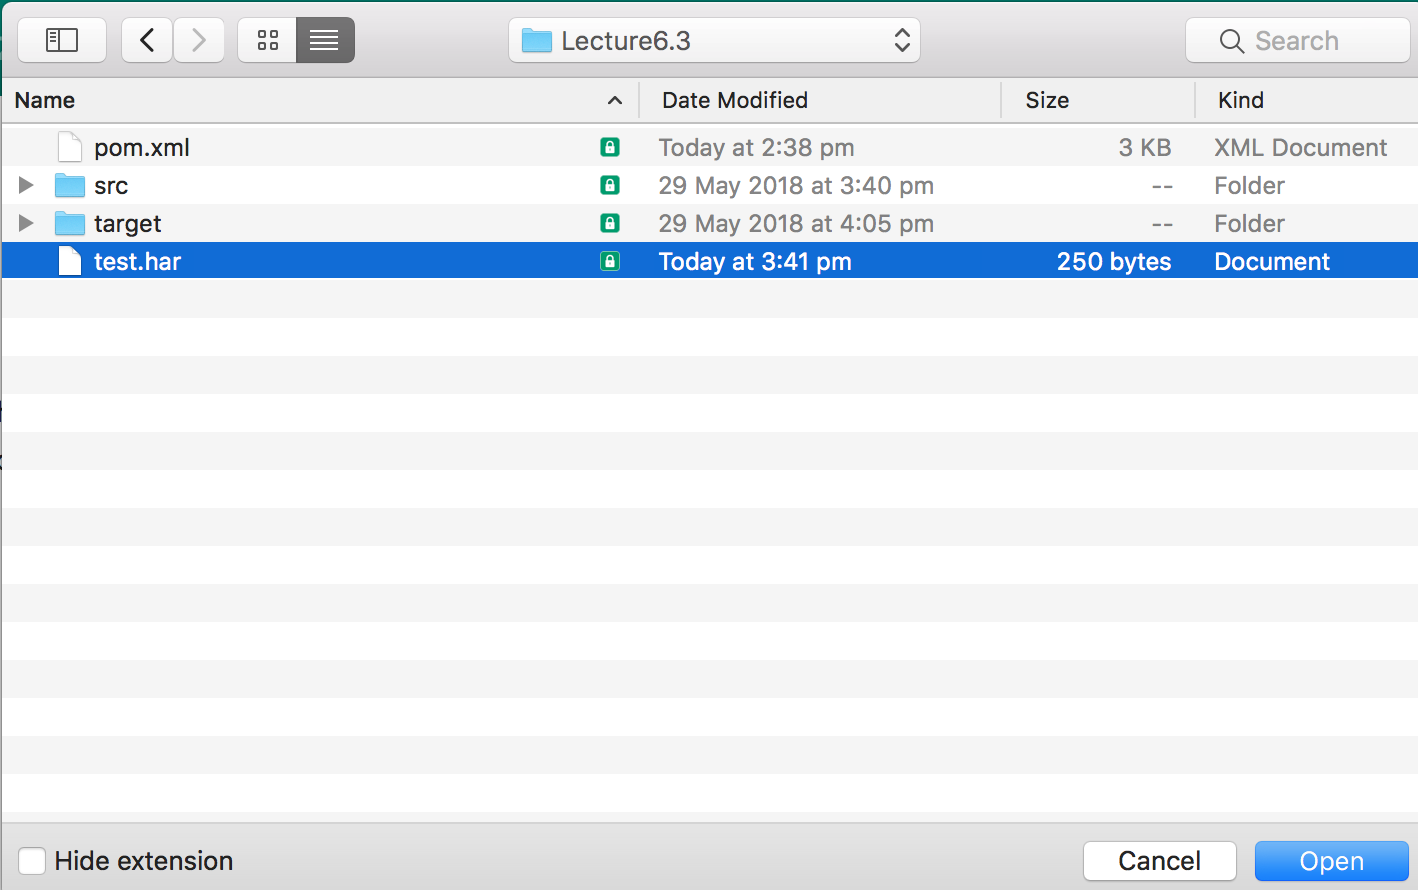
Select the test.har file.
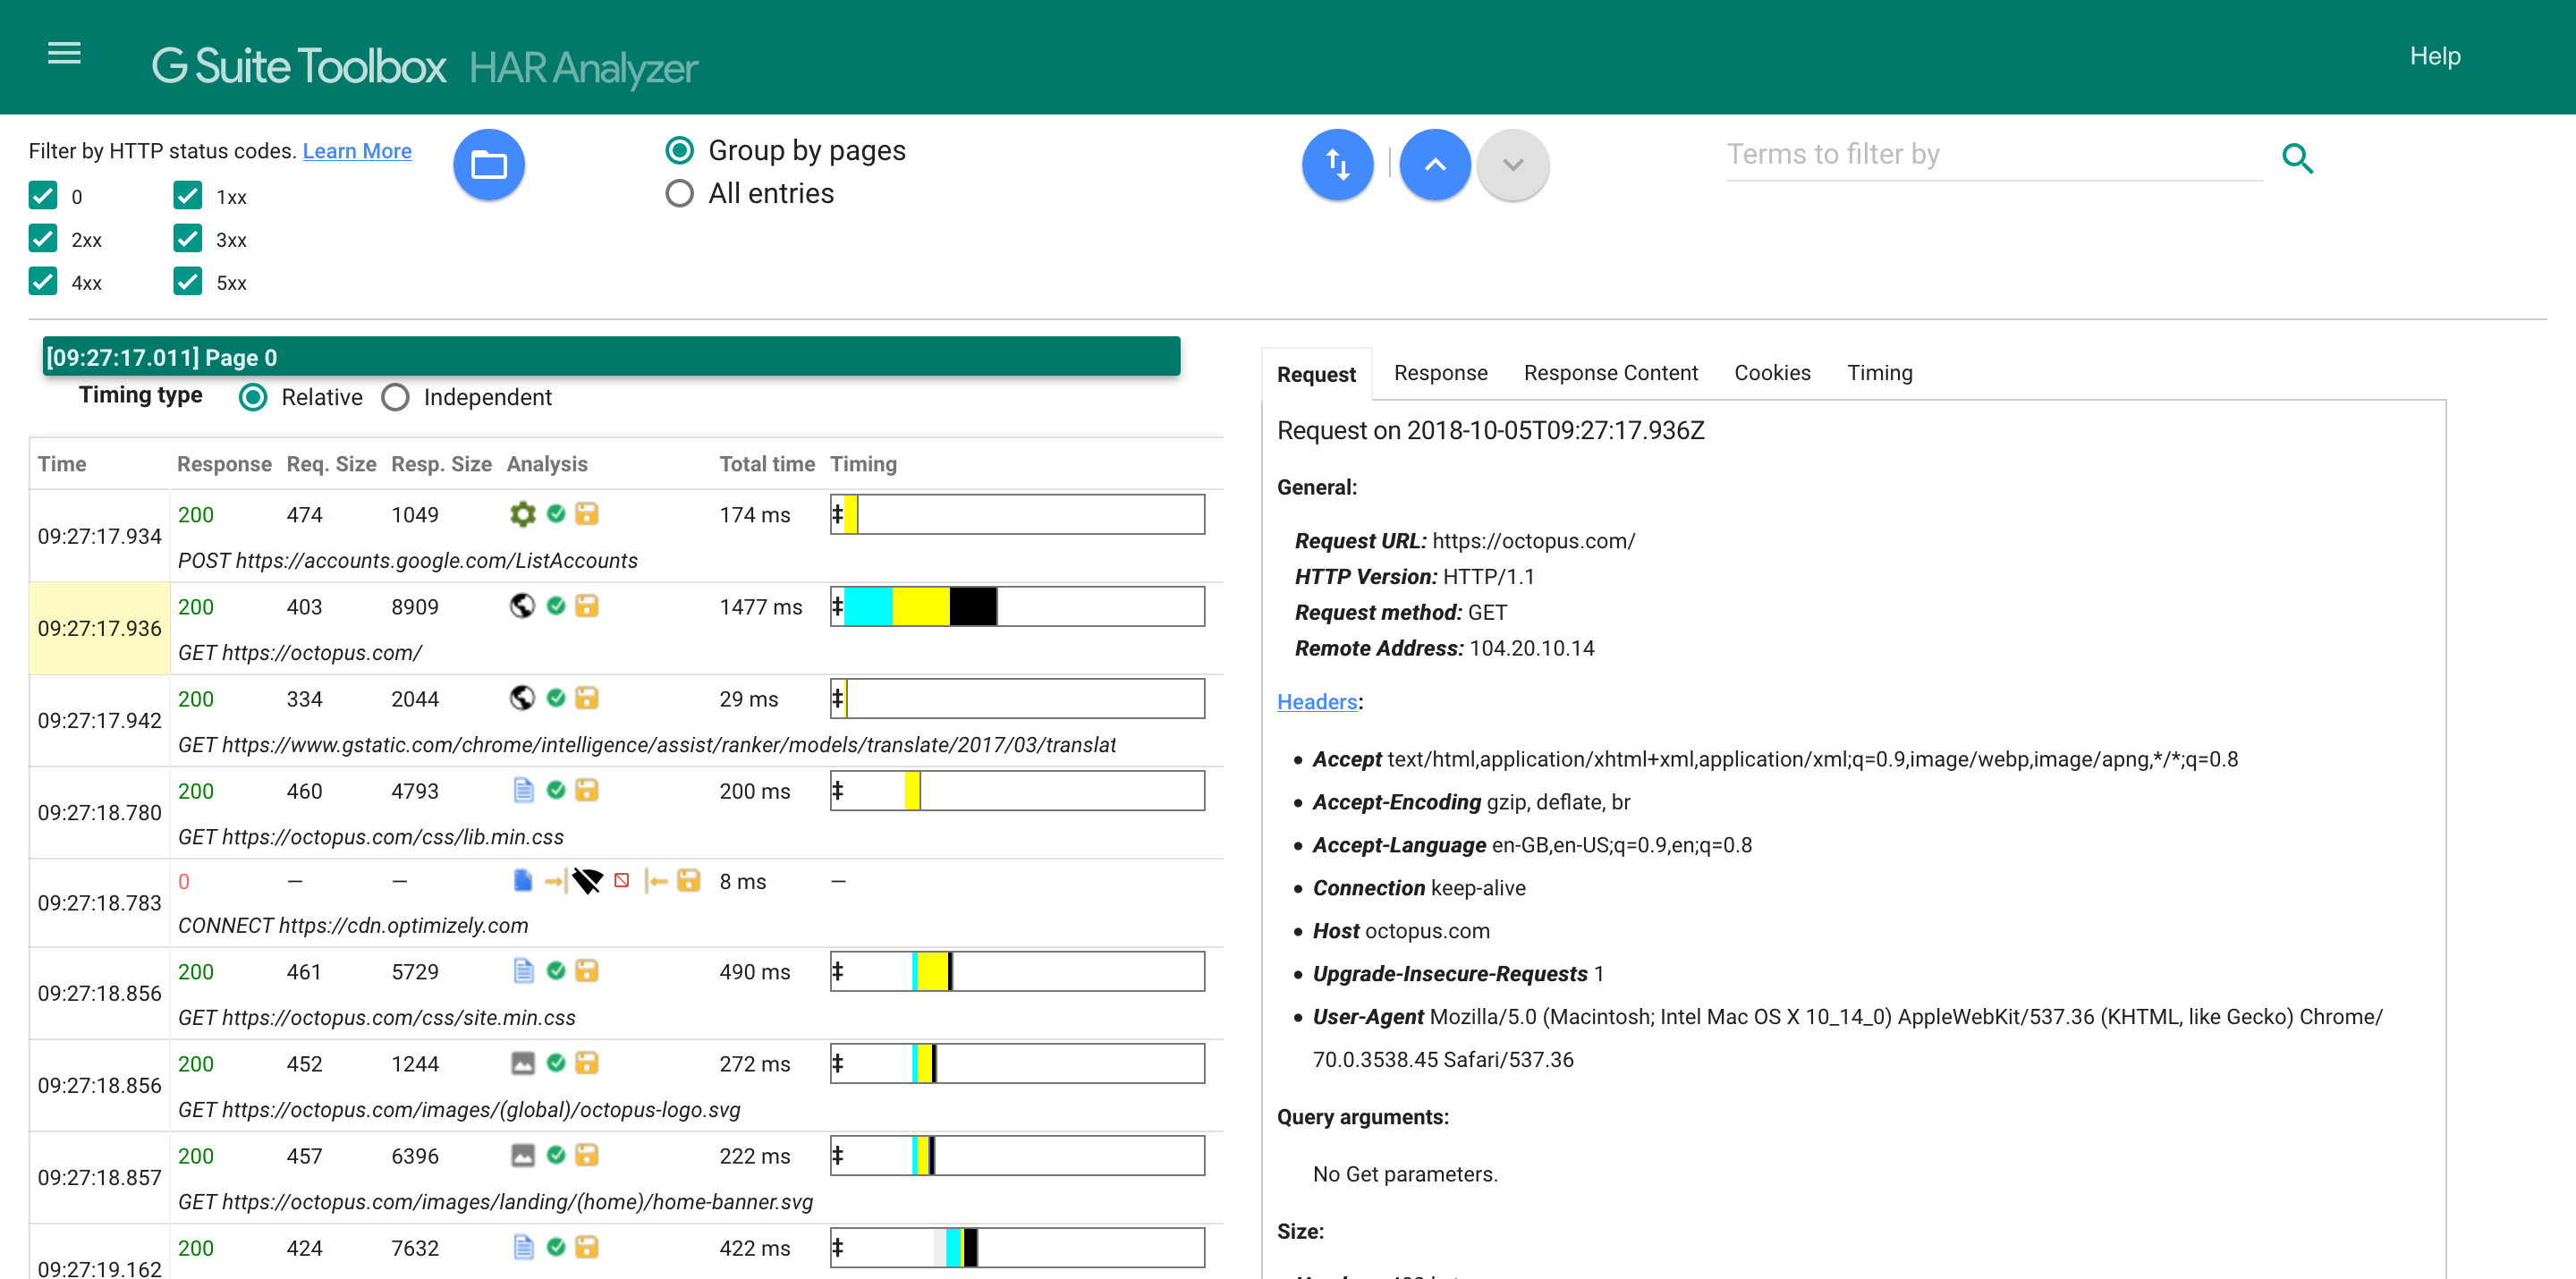
You will then get a table showing all the network requests made as part of the test.
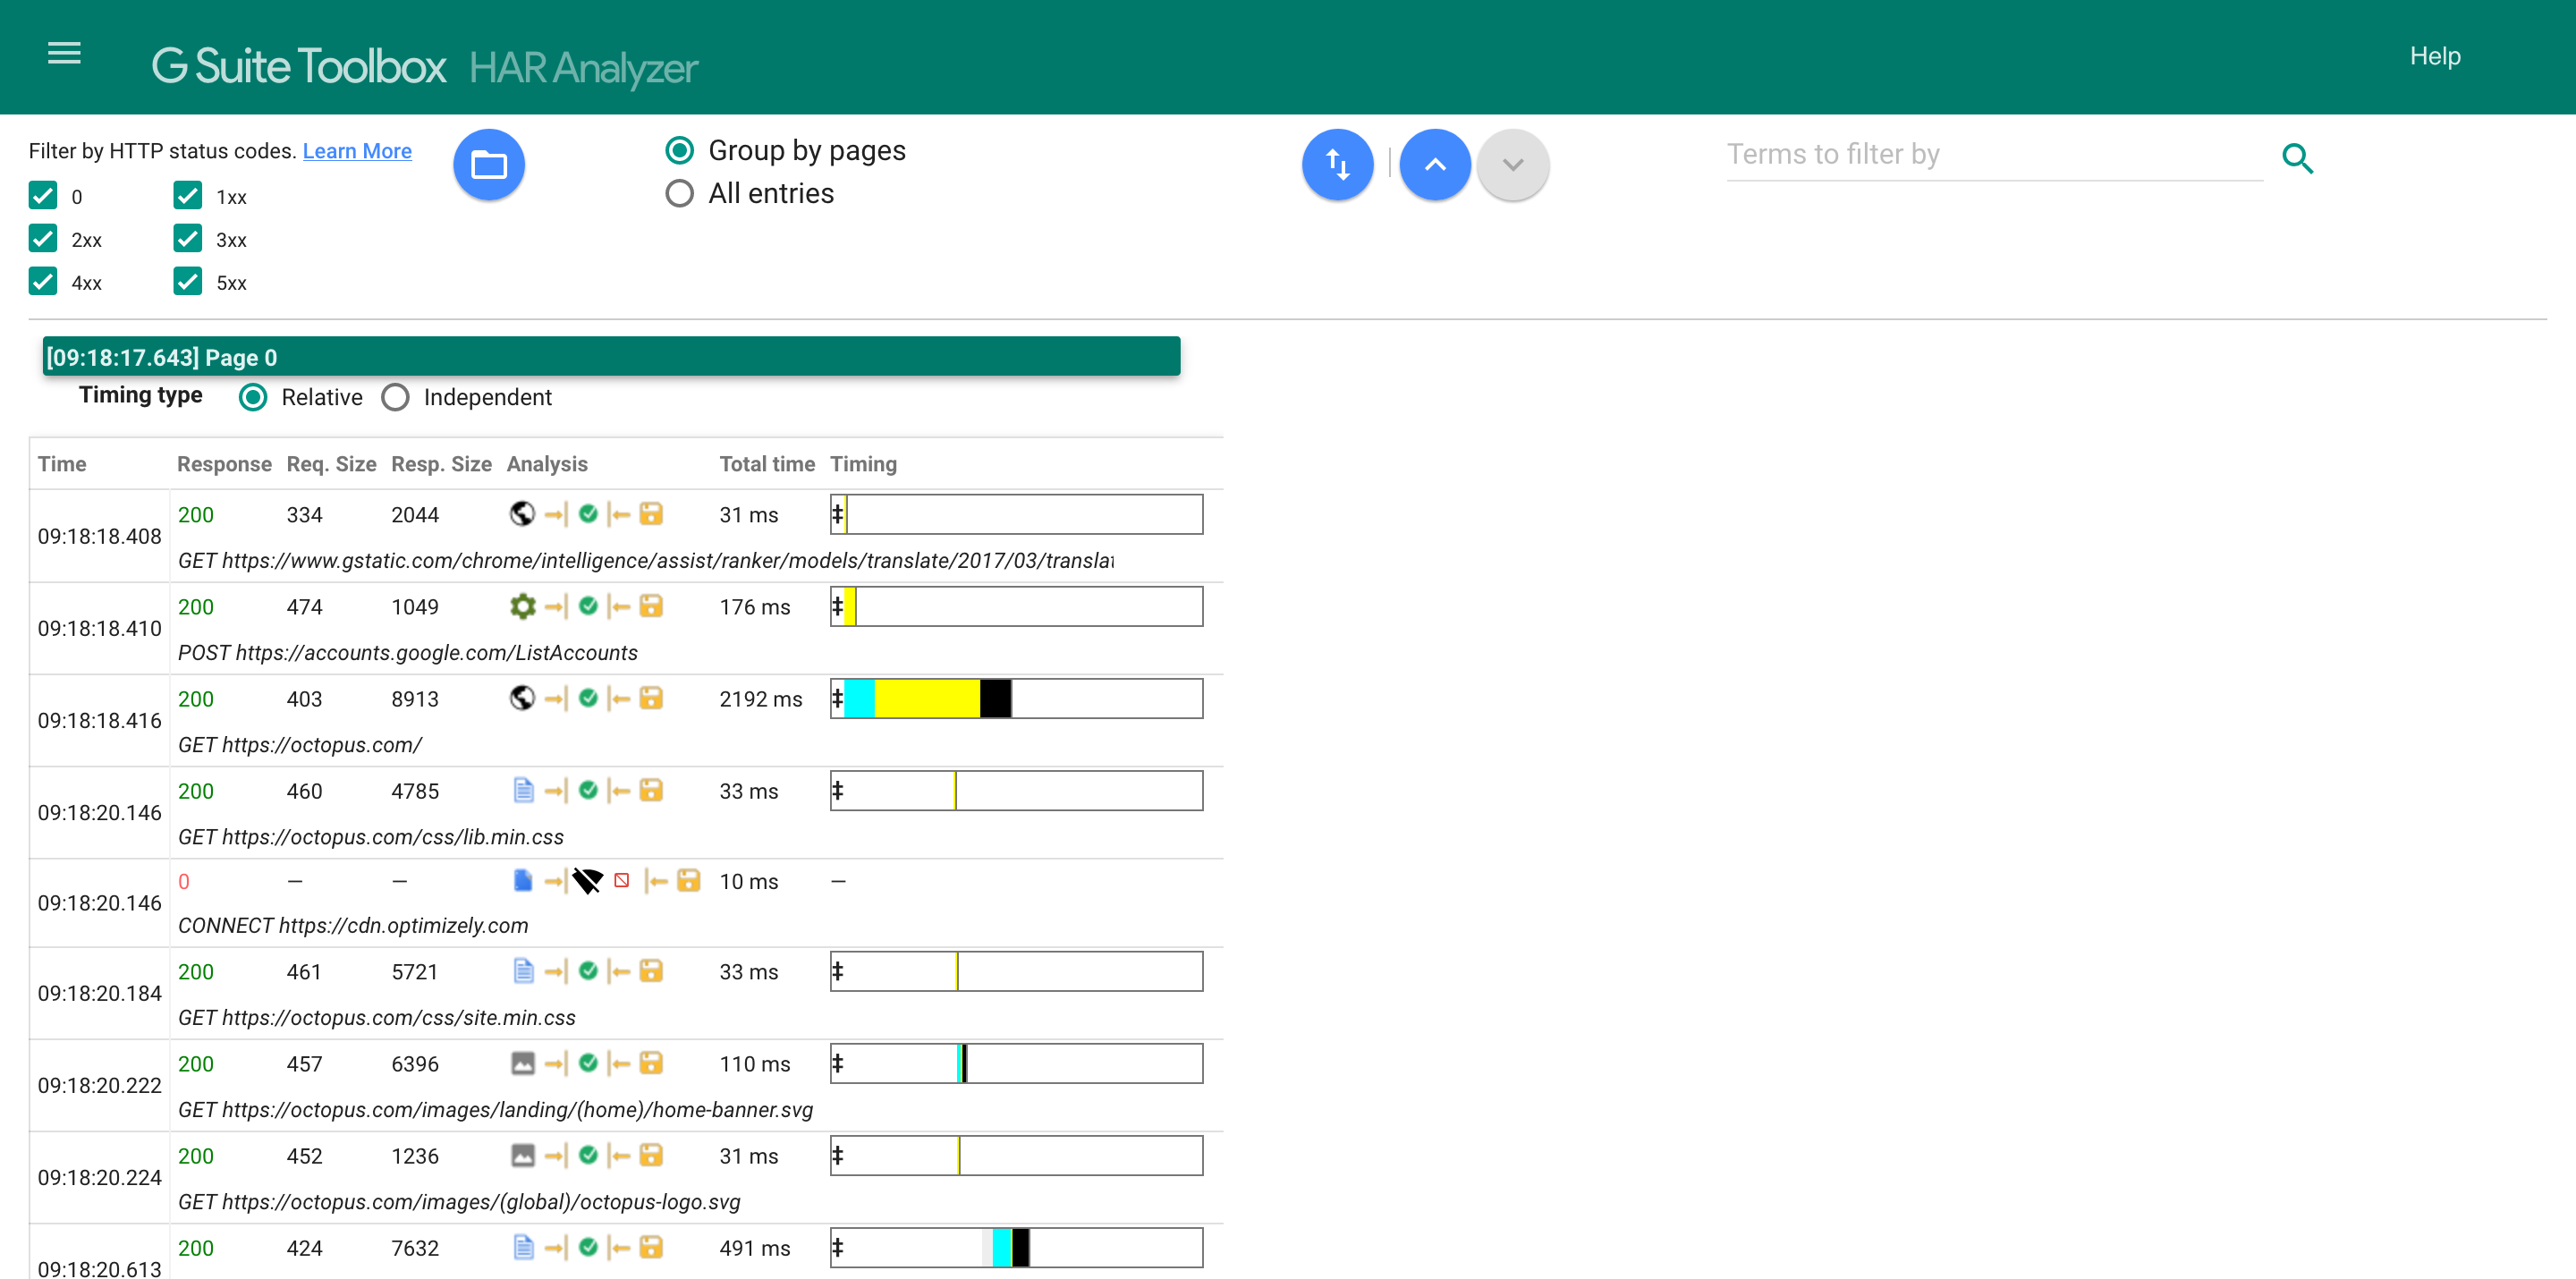
You can filter the results by the HTTP response codes with these checkboxes.
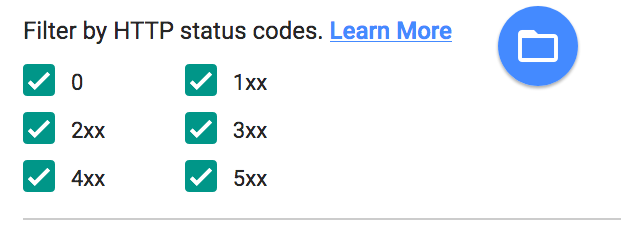
These codes are numbers between 100 and 599, and are grouped in blocks of 100. The 0 response code is a special case, and indicates that no response was returned.
The table below shows the general meaning of the response codes.
| Code range | Meaning |
|---|---|
| 1xx | Informational responses |
| 2xx | Success |
| 3xx | Redirection |
| 4xx | Client errors |
| 5xx | Server errors |
The table shows 7 columns.
| Column | Value |
|---|---|
| Time | The UTC time when the request was made. |
| Response | The HTTP response code. This is the code that is filtered using the checkboxes above. |
| Req. Size | The number of bytes that were sent by the browser. |
| Resp. Size | The number of bytes that were received by the browser. |
| Analysis | Shows icons representing the data that was associated with the request, the status of the request, and whether the request was served from the browsers cache or not. |
| Timing | Displays a graph showing the events that made up the request and how long they took. |
The timings of the responses are shown in a graph in the final column. Hovering the cursor over each of the colored columns shows what kind of event occurred, and how long it took.
If the Relative timing type is selected, the graph represents the total time taken by all requests, with the colored columns showing how much time the individual request took relative to the total.

If the Independent timing type is selected, the graph shows only the amount of time each event took relative to the single request.
Clicking any of the rows shows more details about the request on the right hand side of the page.
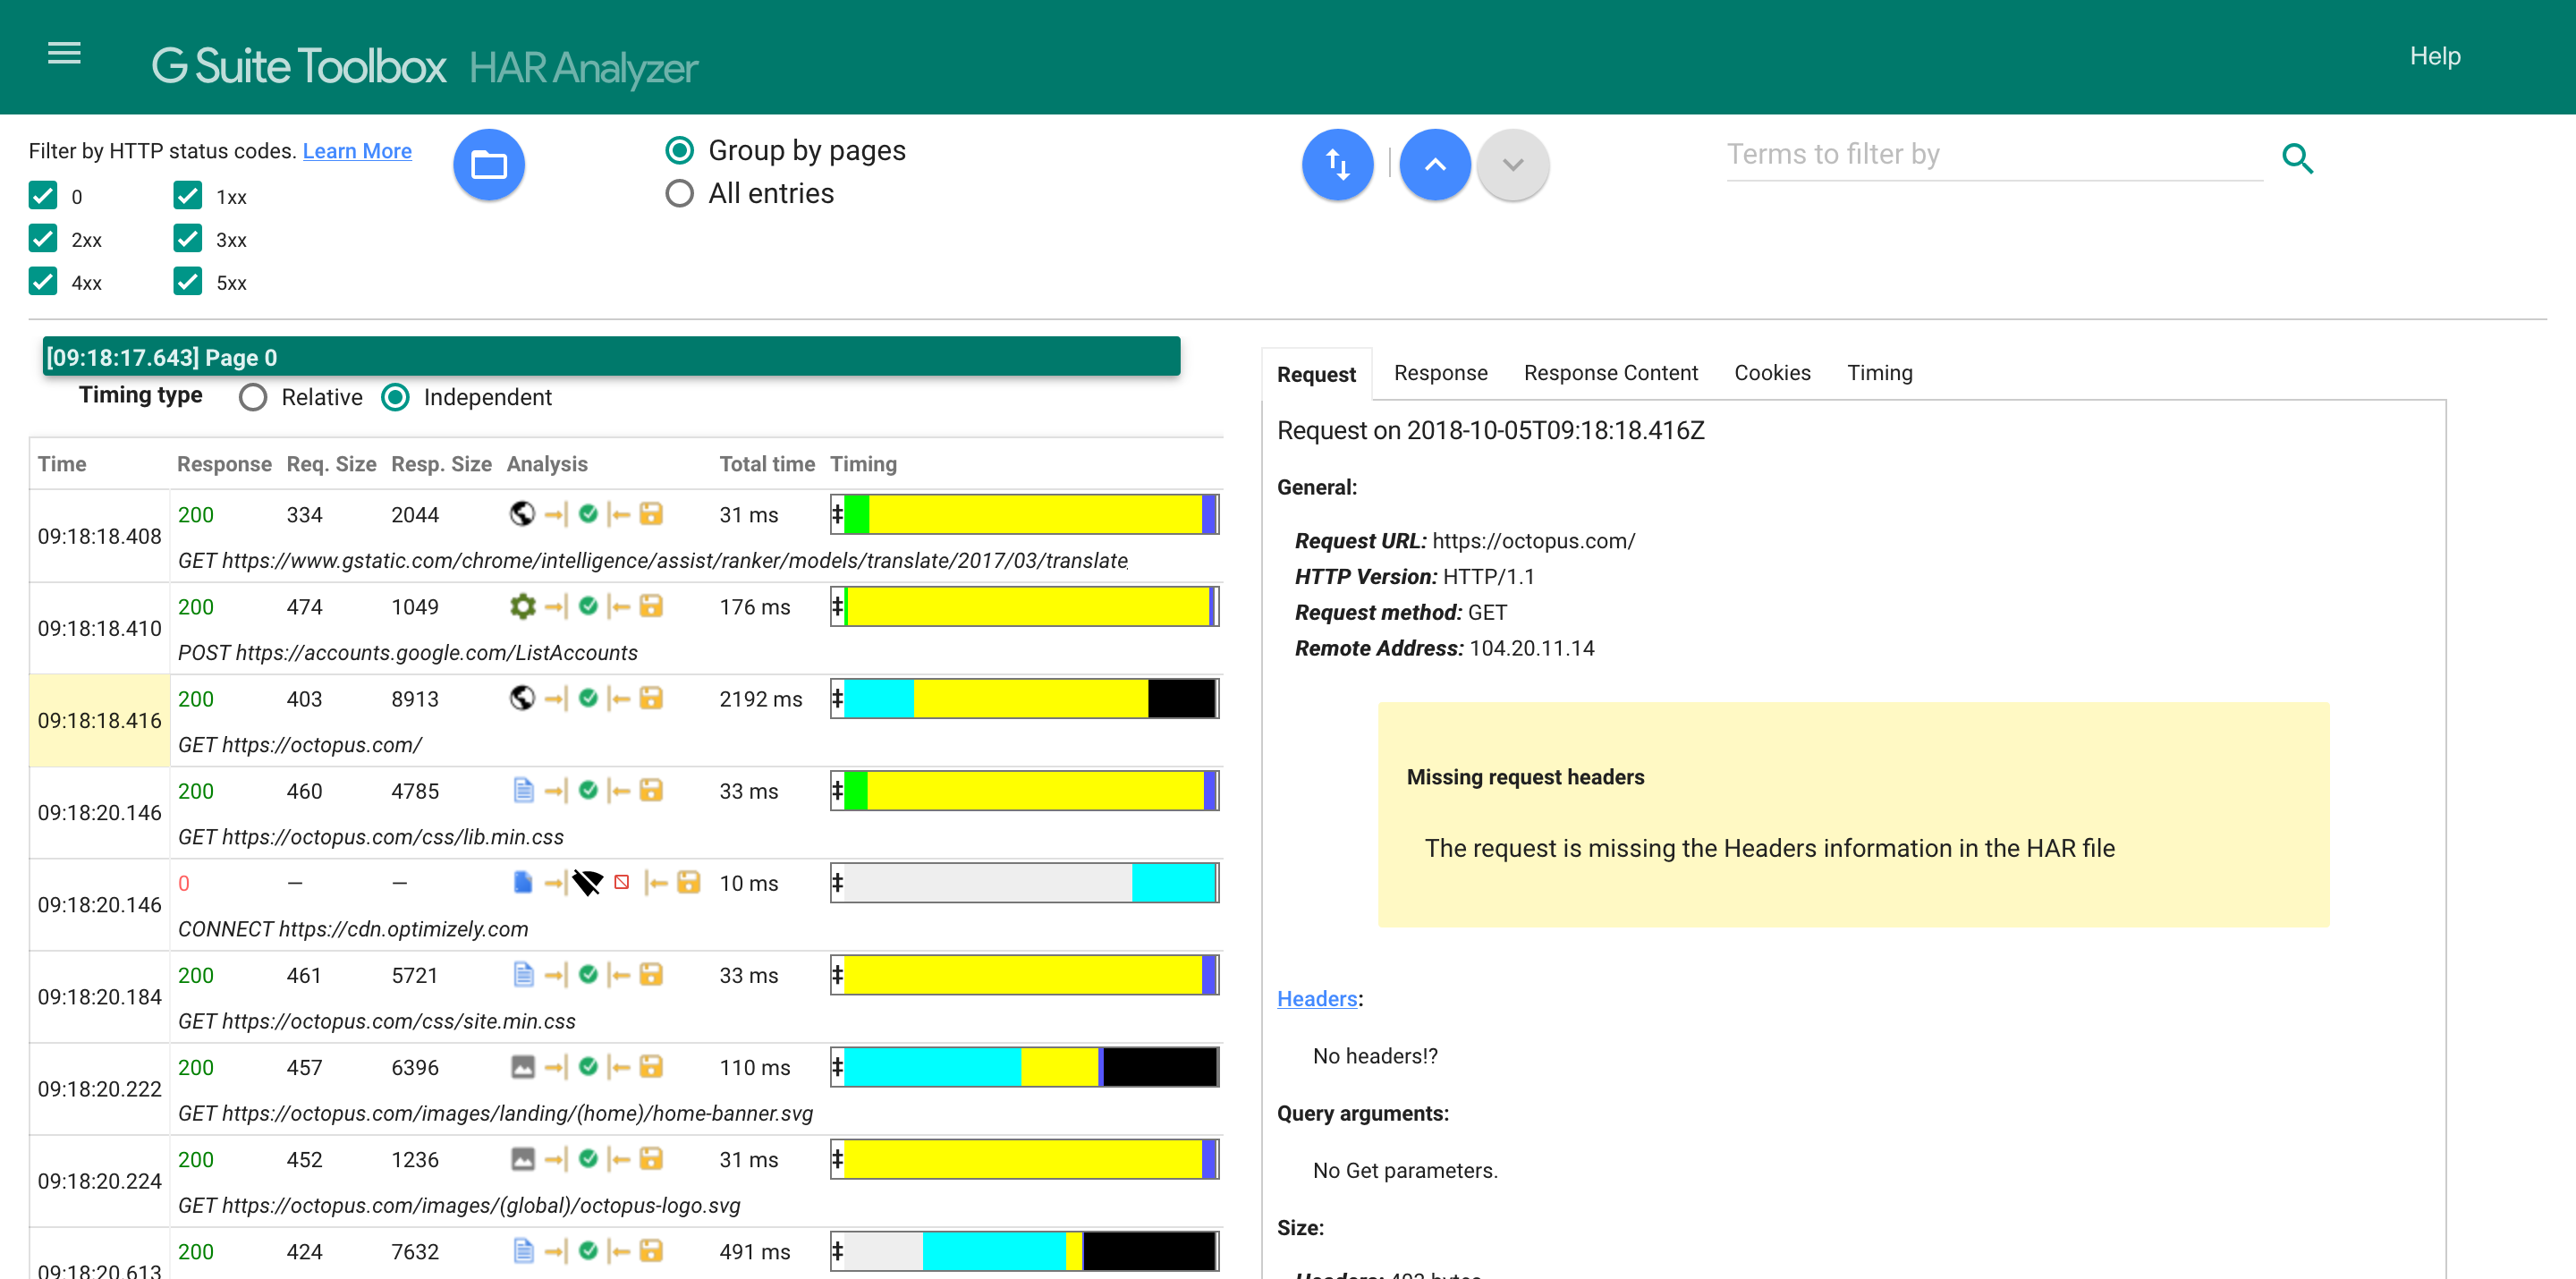
You’ll notice when a request is selected, a lot of the data is missing. This is because by default BrowserMob only captures a small subset of the data that can be saved in a HAR file. To capture all the available information, we create a new method called captureCompleteHarFile() in the AutomatedBrowser interface:
void captureCompleteHarFile();We add the default implementation to the AutomatedBrowserBase class:
@Override
public void captureCompleteHarFile() {
  if (getAutomatedBrowser() != null) {
    getAutomatedBrowser().captureCompleteHarFile();
  }
}
We then implement the method in the BrowserMobDecorator class:
@Override
public void captureCompleteHarFile() {
  final EnumSet<CaptureType> captureTypes =
    CaptureType.getAllContentCaptureTypes();
  captureTypes.addAll(CaptureType.getHeaderCaptureTypes());
  captureTypes.addAll(CaptureType.getCookieCaptureTypes());
  proxy.setHarCaptureTypes(captureTypes);
  proxy.newHar();
}
The change here is to instruct BrowserMob to capture certain additional pieces of data that were sent and received. BrowserMob exposes an enum called CaptureType that defines all the kinds of details that can be saved in a HAR file. In addition, the CaptureType enum has some static methods that provide convenient groups of enums that represent collections of related kinds of details.
We start with the predefined group of CaptureType enums that represent the content:
final EnumSet<CaptureType> captureTypes =
  CaptureType.getAllContentCaptureTypes();
Then we add the predefined group of CaptureType enums that represent the headers:
captureTypes.addAll(CaptureType.getHeaderCaptureTypes());Finally, we add the predefined group of CaptureType enums that represent the cookies:
captureTypes.addAll(CaptureType.getCookieCaptureTypes());These CaptureType enums are then passed to the setHarCaptureTypes() method to configure BrowserMob to save all these details into the resulting HAR file:
proxy.setHarCaptureTypes(captureTypes);Update the test to call the captureCompleteHarFile() method, and run it again:
@Test
public void captureCompleteHarFile() throws URISyntaxException {

  final AutomatedBrowser automatedBrowser =
    AUTOMATED_BROWSER_FACTORY.getAutomatedBrowser("Chrome");

  try {
    automatedBrowser.init();
    automatedBrowser.captureCompleteHarFile();
    automatedBrowser.goTo("https://octopus.com/");
  } finally {
    try {
      automatedBrowser.saveHarFile("test.har");
    } finally {
      automatedBrowser.destroy();
    }
  }
}
You will notice that the HAR file is now several megabytes in size, and that was for one relatively simple page request. More complete tests could generate quite large HAR files, so use the captureCompleteHarFile() method sparingly.
When we analyze the new HAR file we can see there are no longer any warnings about missing information.
HAR files are an incredibly useful way to record and analyze the network iterations made during a test, and thanks to the BrowserMob proxy generating HAR files is quite easy to do. But BrowserMob can do more than just record the traffic that flows through it, and in the next post, we’ll see how BrowserMob can block or modify requests.
This post is part of a series about creating a Selenium WebDriver test framework.
Tags: