
The key to successful change is measuring and understanding the right things with a focus on capabilities—not on maturity.”
From Accelerate, by Nicole Forsgren, Gene Kim, and Jez Humble, 2018.
In 2009, inspired by John Allspaw and Paul Hammonds’ talk at Velocity, Patrick Debois organized a conference. In homage to John and Paul, Patrick called his conference “DevOps Days”. In doing so, he unintentionally gave a broad and fragmented coalition of geeks a unified name and identity. “DevOps” was now a thing… But it was notoriously hard to define.
A passionate and diverse community of tech folks had converged. They agreed on some broad ideas (covering a variety of topics) but struggled to concisely articulate them as a single thing. It’s hard to neatly tie so many ideas about culture, automation, lean IT, metrics, and sharing into a short and focused elevator pitch.
Making matters worse, public perception was… mixed. To some, this fledgling movement came across as naïve and dangerous. These DevOps hippies were actively promoting that developers should push directly to production! In the early days, not a lot of senior folks in “serious” businesses took these DevOps pioneers seriously.
Books like The Lean Startup challenged established IT project management dogma. Mantras like “Move fast and break things” seemed to be deliberately antagonistic to people who valued security and reliability. The “NoOps” subculture appeared to be calling for the mass firing of an entire function. Clickbait-y blog posts explicitly claimed that “The Database Administrator is dead”.
DevOps was supposed to unite us. What went wrong?
Since DevOps was hard to define, and even harder to measure, it was frustratingly hard to make a compelling case either for or against it. Sure, DevOps advocates could wax lyrical about their favorite DevOps case studies: Flickr, Etsy, Netflix, whatever… but then the other side would rightly make accusations about cherry-picking and throw back their own examples, such as the Apollo program, or any other software system that simply cannot be allowed to fail (like aerospace, or healthcare for example).
This was getting us nowhere. We needed clarity. We needed data. We needed a little scientific rigor.
The State Of DevOps Reports
In 2012, at Puppet, Alanna Brown recognized this need and started the annual State of DevOps Reports. Later she brought in others, including Gene Kim, Nicole Forsgren, and Jez Humble. (What a team!)
Nicole, a PhD with some serious research credentials, lead the research from 2013 to 2017. Each year, the team surveyed tens of thousands of tech folks globally, across different job roles and industry sectors. They examined the results, sought out conclusions, and published the data with their findings.
They elevated the discussion about DevOps. This wasn’t about tribal value signaling anymore. We had cold, hard data. We could talk about facts rather than opinions. We could talk about global trends rather than individual case studies.
Most importantly, we could, authoritatively, show people the money.
In 2018, Nicole, with Gene and Jez, who by now had formed DORA (DevOps Research and Assessment) wrote Accelerate. In it, they looked back at the data from the 2013-17 reports and explained what the data revealed.
Their conclusions were striking.
How to benchmark performance in tech
Nicole, Gene, and Jez wanted to understand why some teams perform better than others. To do that, they first needed a yardstick to measure the “performance” of an IT team. This was no small feat. The authors discussed the challenges with various traditional metrics such as lines of code, story points, and use etc. Defining the performance of an individual or team based solely on the work they put in was problematic.
The authors chose instead to focus on outcomes rather than outputs. When they did, they noticed something unique about 4 specific metrics, that covered a balance of both performance and stability. These metrics have become known as the “DORA metrics”:
- Deployment frequency
- Lead time
- Mean Time to Recovery (MTTR)
- Change failure %
When teams performed better, specifically against these metrics, they saw a unique and statistically significant, predictable improvement in business outcomes, including:
- Profitability
- Market share
- Productivity
This link wasn’t just observed in “tech companies” (those who are known for their software products). This was true across all business sectors. By 2018, high-performing technology teams delivered a competitive advantage in every business. What’s more, DORA went on to discuss other “not-profit” organizations, where positive outcomes weren’t solely defined by bank balances. Again, they found that the DORA metrics were reliable predictors of success.
Every company is a software company now.
If you want to get your shareholders, executives, or key stakeholders on board with your DevOps transformation, you need to get them to read Accelerate.
Why are the DORA metrics effective?
There’s an old myth in IT that out of speed, quality, and cost you have to pick two. I’m here to tell you that’s rubbish.
The DORA metrics are interesting because they promote various positive feedback loops that reinforce good practices with respect to speed and quality simultaneously. This combination allows teams to deliver better quality software, faster. (And, thus, for less money.)
Deployment frequency
As Chuck Rossi observed while at Facebook: “If we want more changes, we need more deployments.”
Chuck was under pressure to increase the pace of development. In an effort to deliver more changes, deployments at Facebook were getting bigger and more complicated. However, as deployments grew, they became much less reliable. When they failed, they failed badly. Finding the problem was like searching for a needle in a data center. Facebook was failing to meet its productivity targets by increasing deployment size.
If the goal is to ship more changes, it’s essential to “scale out” deployments, rather than “scale up”.
By focussing on radically increasing deployment frequency, rather than deployment size, Facebook was much more successful. They were able to ship more changes, while suffering fewer major deployment failures. When stuff did go wrong, it was easier to diagnose and faster to fix.
They learned that productivity is a function of deployment frequency, not deployment size.
However, to radically increase deployment frequency, we need to think differently about the delivery process (at an organizational level). If each deployment requires a two-week test cycle, an overly-bureaucratic review process, and a 48-hour downtime window, we can’t execute multiple deploys a week – let alone 10 deploys a day! (Like John and Paul presented at Velocity.)
If the goal is to increase deployment frequency, we need to understand lead time.
Lead time
Lead time is a loaded term. The Accelerate authors defined it in a specific way.
They drew a line between the creativity, innovation, research, and decision making associated with choosing what to build (which they call “the fuzzy front end”) and the practical engineering work required to deliver it. In Accelerate, lead time is defined as the time between when a developer starts work on something, and when that work has been delivered (and validated) in production.
(They explicitly don’t count the amount of time some bug fix or feature request has been waiting on the backlog behind a long tail of higher priority JIRA tickets.)
With poor performers measuring lead time in months, and high performers measuring lead time in hours, it can be mind-boggling for folks in either camp to imagine how the other group delivers software without breaking things. For poor performers, a lot of their long lead time is invested in testing, approvals, and validation, so it’s natural for them to assume that moving faster requires sacrifices with respect to quality or safety.
However, for most orgs who haven’t taken a serious look at lead time before, they’ll probably see big improvements by seeking to understand where the longest waits, delays, and mistakes occur, and then making changes or automating steps to avoid/reduce them. They’ll see another huge boost by breaking large batches of changes into smaller, independently deliverable batches. Not only will these be much faster and safer to deliver, but it’ll be easier to pivot if necessary before some broader epic has been completed, without sacrificing current progress.
Consistently short lead times are not the result of rushed development work or skipped test phases. They are the result of more intelligent teamwork and well-prioritized automation efforts. They result in code being reviewed in a timely fashion, bugs being caught more quickly, improved quality, safer deployments, and better agility.
Mean Time to Recovery (MTTR)
The best way to appreciate MTTR is to contrast it with MTBF (Mean Time Between Failure).
The focus on MTTR is an explicit recognition that we care more about reducing the impact of failure than we do about avoiding failures entirely. That’s not to say we don’t care about avoiding failures. Of course we do. (More on that shortly.) We just care more about our ability to recover when we do fail. And we recognize that safety measures that significantly detract from deployment frequency and lead time should be avoided since they create their own form of systemic risk. (Longer lead time, bigger batches, riskier deployments, etc.)
Flatly: Accelerate has demonstrated that the DORA metrics matter. (And MTBF doesn’t.)
If our failures are fixed in minutes, if they only affect a tiny fraction of our users, and if all the data can be recovered quickly… is it really so terrible if we make a mistake every now and then? Shouldn’t we focus more energy on our ability to recover from failure, rather than pursuing the impossible goal of catching every mistake?
When we demonstrate consistent improvement with respect to MTTR, instead of MTBF, it’s easier to make the case for reduced bureaucracy. This reduces lead time, increases deployment frequency, reduces deployment size. This results in even safer deployments, with even better MTTR.
We turn a vicious cycle into a virtuous one.
Change failure percentage
Testing is the often-forgotten part of DevOps. Continuous Deployment, without appropriate testing, is a sure-fire way to deploy bugs to production more quickly than before.
While our focus on MTTR over MTBF demonstrates our acceptance that failures will occur, that doesn’t mean we’re happy when they do. DevOps is about building quality in, just as much as it’s about deploying small and often. We want our deployments to be boring, rather than nail-biting. We want to be confident they’ll work.
But we need to replace slow checks with fast checks.
We need to invest in automated unit tests, integration tests, dry-run deployments, and smoke tests. We need to invest in frequent, fast, small code reviews, over slow, batched-up reviews by committee. After all, the more code being reviewed at once, the fewer issues likely to be raised.
Note: while we are trying to reduce the likelihood of deployment failures, we aren’t trying to reduce the total number of deployment failures. That might happen, but it’s not our priority. Worrying about whether the total number of failures is increasing, or decreasing is a distraction.
If that sounds reckless, consider which of the following companies delivers a higher quality product:
| Company A (deploys quarterly) | Company B (deploys 10 times a day) |
|---|---|
| 4 deploys in 2021 | 3,650 deploys in 2021 |
| 50% failure rate | 1% failure rate |
| MTTR: 2 days | MTTR: 1 hour |
| 2 failures x 48 hours recovery time = 96 hours downtime | 36 failures x 1 hour recovery time = 36 hours downtime |
Company B suffers significantly more frequent failures. However, it’s probably considered the more reliable service by its users. Company A had roughly 3 times more downtime and we’ll remember those frustrating multi-day outages for years to come.
By combining a focus on MTTR (to reduce the impact of failure) with a concerted effort to improve the reliability of deployments (defined by change failure percentage) it’s practical to radically increase deployment frequency while also improving quality. (Even if the total number of failures actually increases.)
How to improve performance
Of course, we should be tracking and reporting on our progress with respect to the DORA metrics. Anyone who uses an automated ticketing system and a release orchestration tool (like Octopus Deploy) probably has access to most of the data they need.
Imagine a world where everyone has access to a dashboard reporting on the DORA metrics for each product or team. Teams would be incentivized to emulate the practices of the top performers. Management will see which teams most urgently need their support. Happy days.
The key to successful change is measuring and understanding the right things with a focus on capabilities—not on maturity.”
From Accelerate, by Nicole Forsgren, Gene Kim, and Jez Humble, 2018.
However, Accelerate doesn’t just give us a scoreboard. Their research also highlights a set of 24 practical capabilities that have been demonstrated to improve performance. The 24 listed capabilities broadly align with the practices that have been promoted by DevOps enthusiasts for years.
Honestly, since Accelerate, the term “DevOps” is less important. Those 24 capabilities have become the default convention for perceived good practice. It has been demonstrated that they work.
It’s probably unsurprising that source control, automated deployment, and continuous integration feature in the list. In fact, they’re the top 3. But it’s a long list, and it isn’t ordered by priority. Accelerate embraces the fact that DevOps is about much more than deployment pipelines.
The capability list is long and can feel daunting. That’s OK. One person can’t be responsible for implementing all of it, and any organization that tries to make too many changes at once is unlikely to succeed. Don’t ask yourself “how long will it take me to do all that?” Instead, choose where to start.
In my experience, getting a cross-functional group together for a couple of hours with a whiteboard to map the “value stream” is a pretty good first step. Highlighting areas that tend to create the most delays or failures focuses the mind on the most important problem to solve first. It’s also reassuring to know you’ve done your research and you may be able to make some estimates about how fixing some bottleneck will impact your DORA metrics.
Having said that, Gene Kim gave us a pretty good pointer in Beyond the Phoenix Project. Speaking from personal experience, his observations mirror my own with hundreds of customers throughout my career:
What I find so amazing, is that as an organization goes from code deployment lead times that are measured in months, maybe even in quarters, down to minutes, the constraint moves in some pretty predictable ways.”
Gene Kim, in Beyond the Phoenix Project, 2018.
He goes on to list the following bottlenecks, in order:
- Environment creation
- Deployments
- Testing
- Architecture
- New product ideas
Assuming your value stream mapping exercise returns similar results, it’s probably a good idea to start by investing in the capabilities that make these tasks easier, faster, and more reliable. The likely result will be improved DORA metrics scores.
And we know that strong DORA metrics scores predict commercial success.
A call to action
You’ve read this far. Either I convinced you about the value of the DORA metrics, or I didn’t.
If you aren’t convinced:
I encourage you to read Accelerate.
In fact, just read part 1. For now, that’s the only bit that matters.
Back before the pandemic, as a consultant, I used to drive a lot. I listened to the whole of part 1 in audiobook form as I drove home from a consulting gig. It only took about an hour. (At double-speed. Anything else sounds slow to me now.) Nicole et al articulated so succinctly the issues I’d been witnessing all day but which I’d struggled to explain to my customer.
As soon as I got home I ordered a hard copy for next day delivery.
If Nicole’s research is correct (and I’ve never seen a serious academic attempt to challenge her methods or findings) I promise that part 1 of Accelerate is worth an hour or two of your time.
If you are convinced:
I challenge you to answer the following questions:
- How does your team score against the DORA metrics?
- How are you planning to track your performance against the DORA metrics over the next couple of years?
- What changes are you going to make to drive improvement?
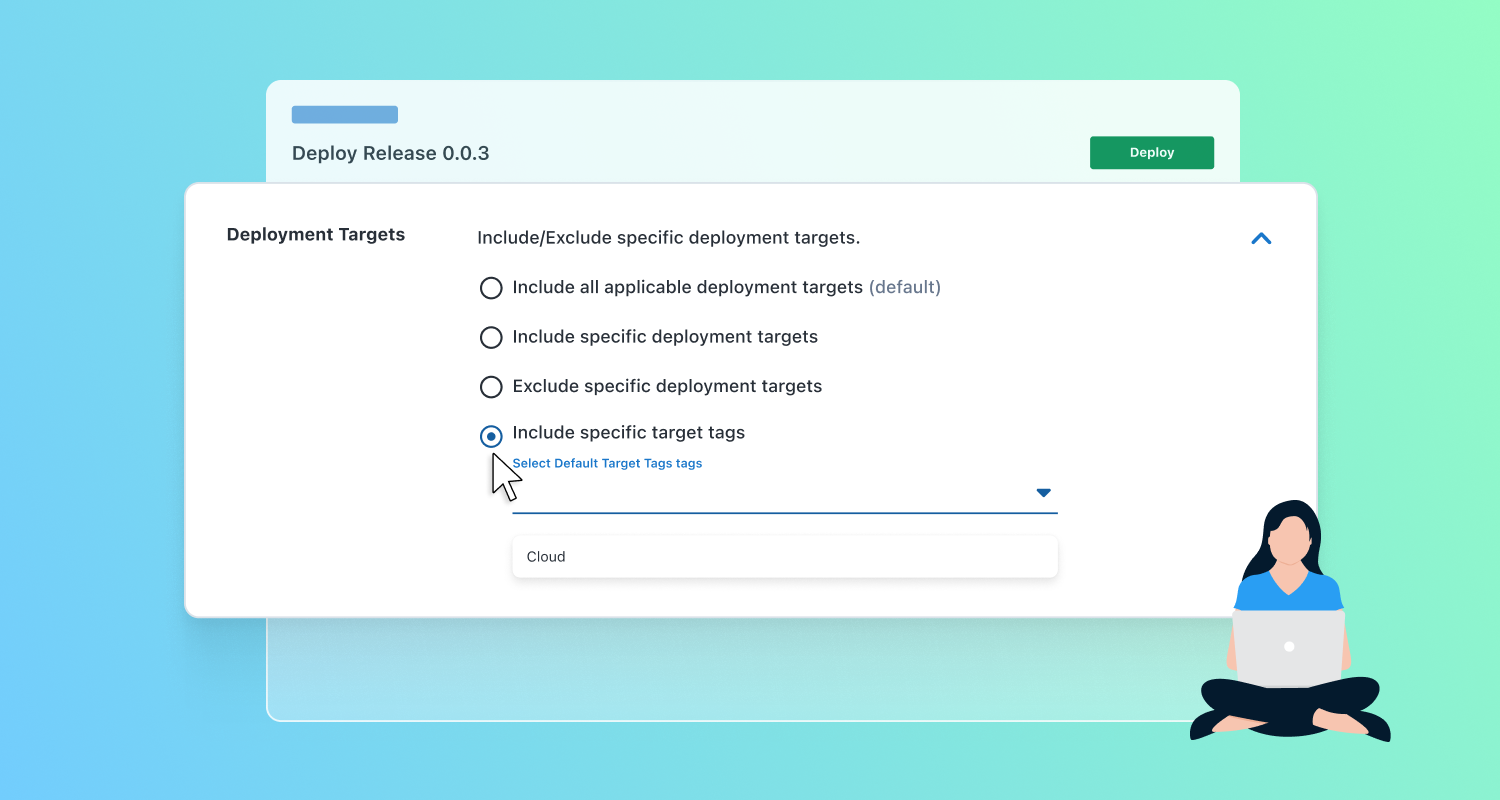
DORA metrics in Octopus
Octopus Deploy 2022.3+ includes support for DevOps Insights with built-in DORA metrics. This built-in reporting gives you better visibility into your company’s DevOps performance by surfacing the 4 key DORA metrics:
- Deployment Lead Time
- Deployment Failure Rate
- Deployment Frequency
- Mean Time to Recovery
These metrics help you make informed decisions on where to improve and celebrate your results.
Project insights are available for all Octopus projects, including existing projects.
Space level insights are available for Enterprise customers at a space level and cover all projects in that space.
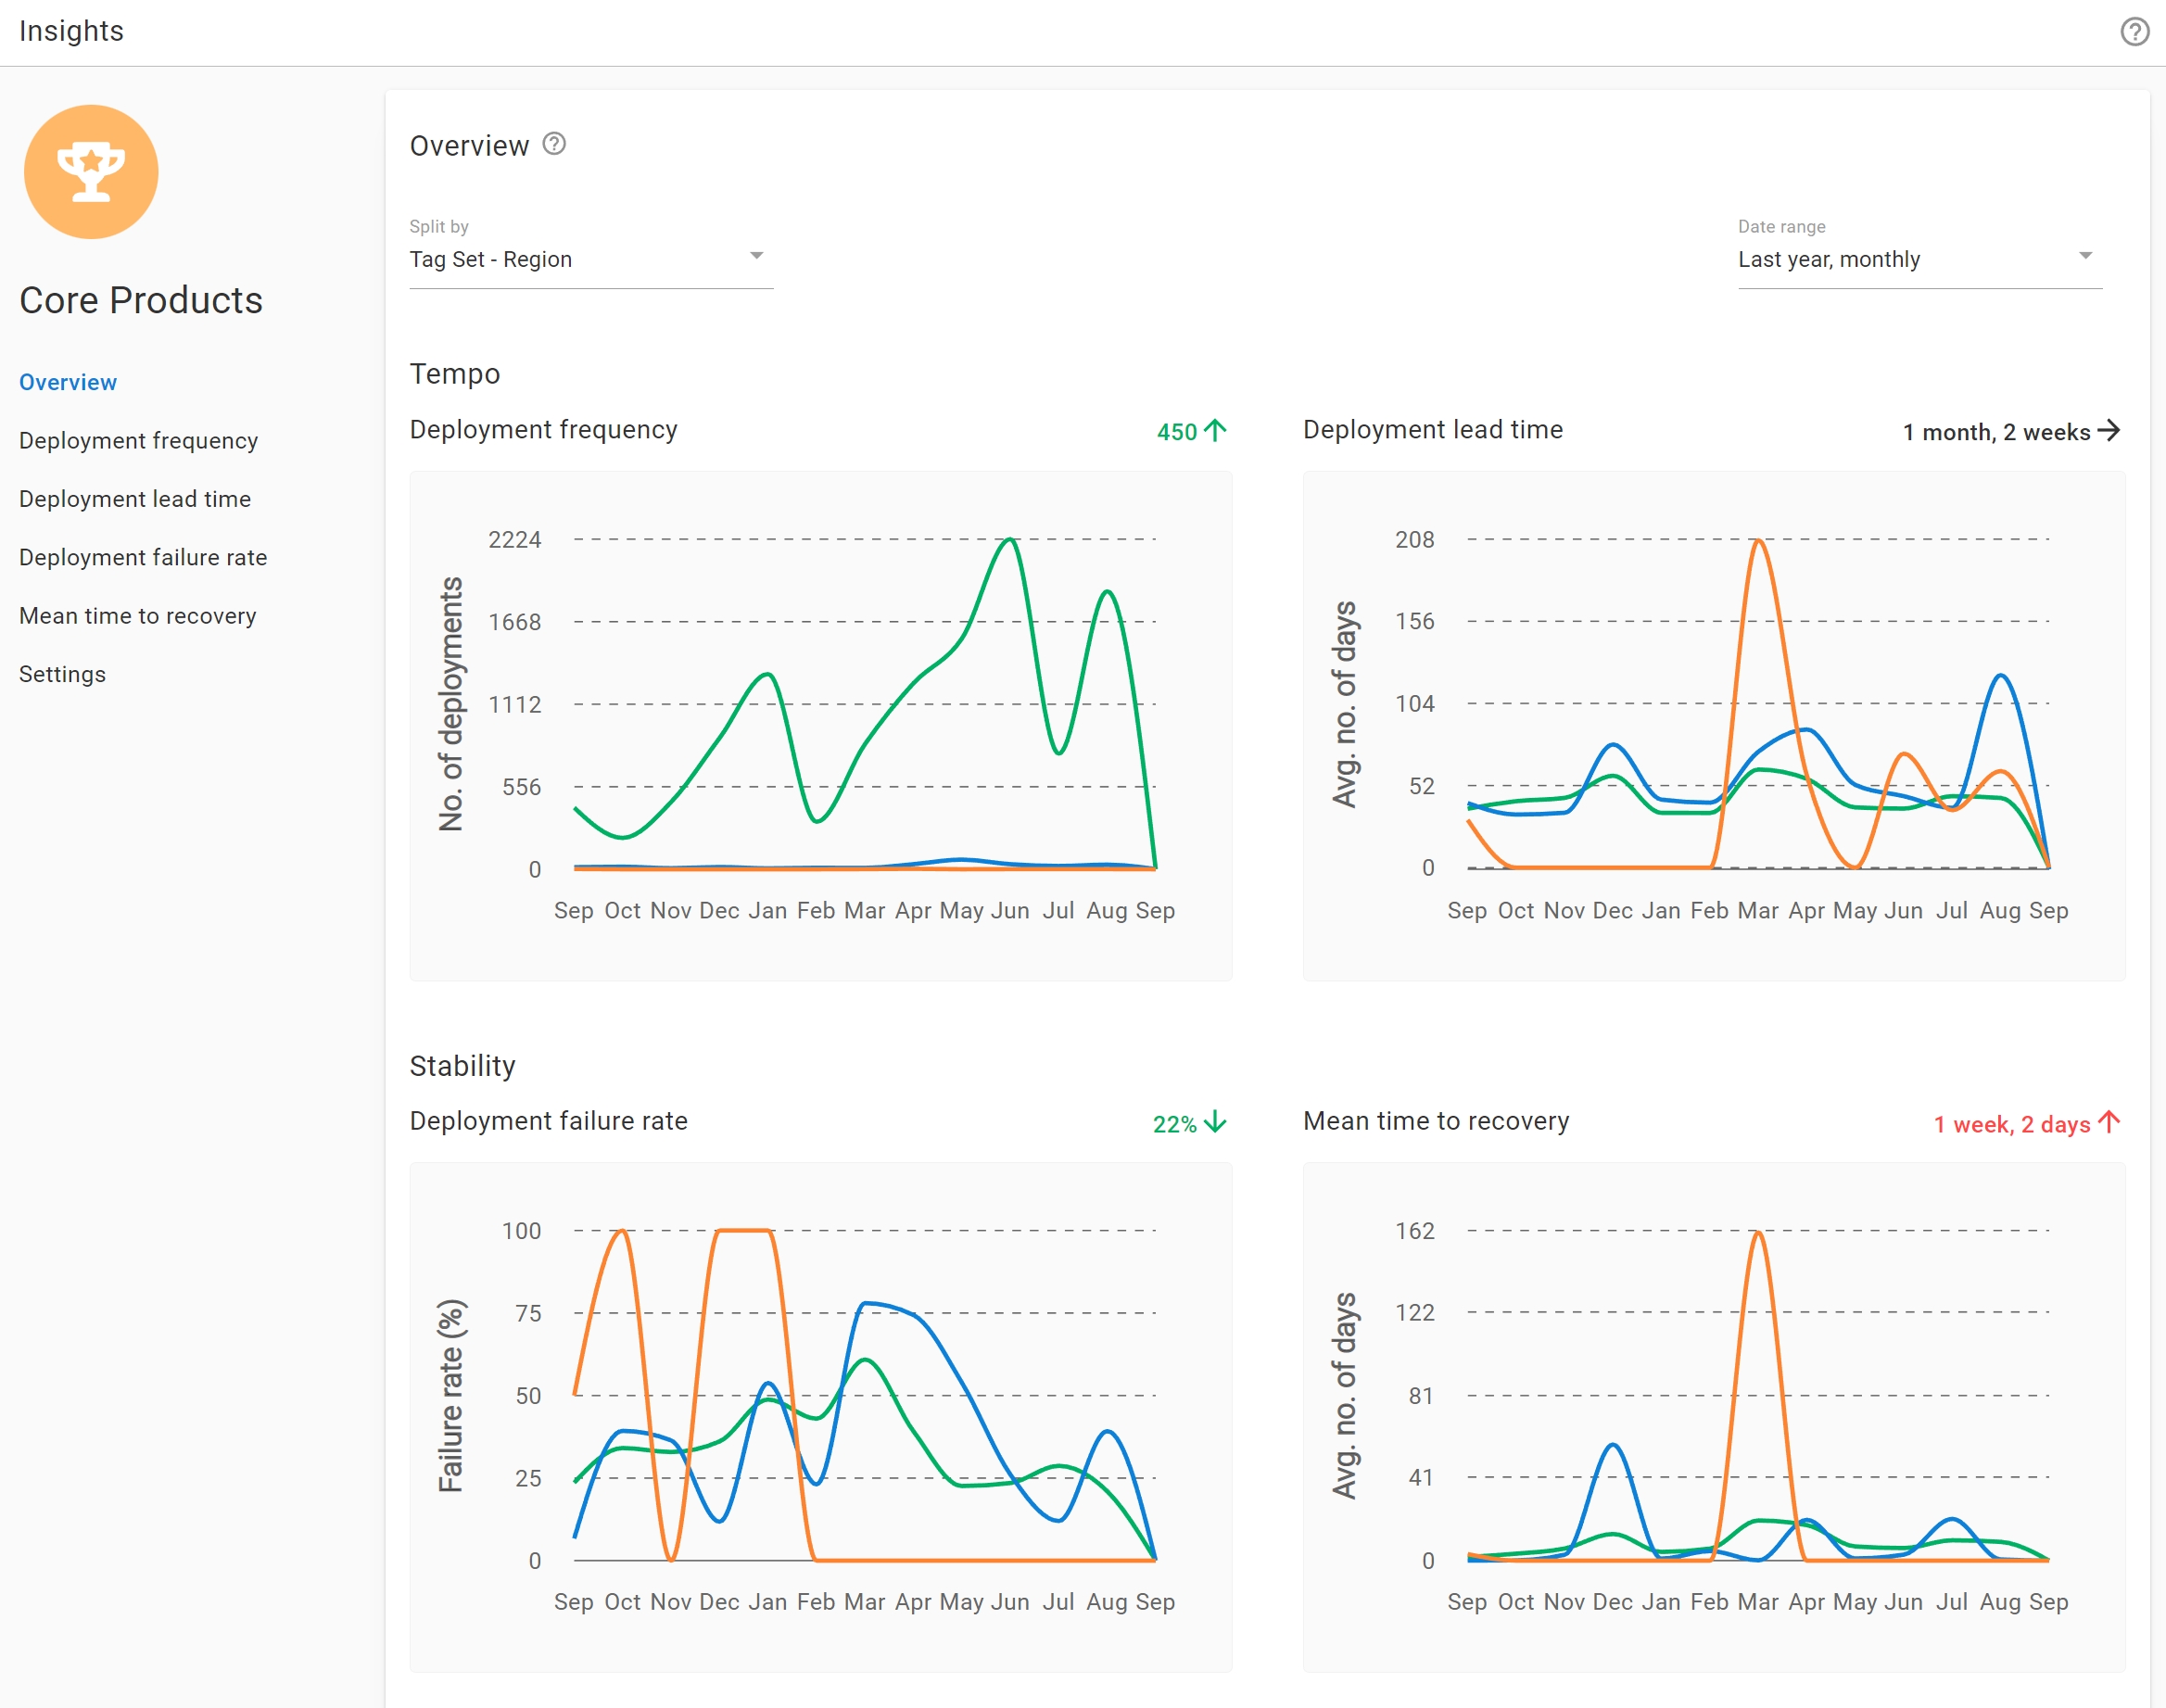
Space level insights are available via the Insights tab and provide actionable DORA metrics for more complex scenarios across a group of projects, environments, or tenants. This gives managers and decision makers more insight into the DevOps performance of their organization in line with their business context, such as team, portfolio, or platform.
Space level insights:
- Aggregate data across your space so you can compare and contrast metrics across projects to identify what’s working and what isn’t
- Inform better decision making: identify problems, track improvements, and celebrate successes
- Help you quantify DevOps performance based on what’s actually happening as shown by data
Together these metrics help you qualify the results of your DevOps performance across your projects and portfolio.
Learn more about DevOps Insights in our docs. Explore the DevOps engineer’s handbook to read more about DevOps and CI/CD.
Happy deployments!
Tags: