
The built-in Octopus dashboard shows you which releases are deployed to each environment. When you manage deployments across many tenants and teams, you might want a more focused view. Which tenants are 2 releases behind? Which approvals are holding up the Payments team? How far has a release progressed across environments and tenants?
You can build these views with the Octopus REST API, but first you need to understand its endpoints, request bodies, and deployment step properties. Octopus’s llms.txt file brings that information together in a format AI coding agents can read and understand.
For this blog post I gave the file to a coding agent and asked it to:
- Create realistic test data for a multi-tenant company with several teams
- Build custom dashboards for those teams
- Visualize release progress in a new and interesting way
Everything below ran against a local Octopus install. I used Claude Code, gave it the URL of the llms.txt file, an agent API key, and the prompts quoted throughout this post.
What is llms.txt
llms.txt is a convention for publishing a plain Markdown file at /llms.txt that condenses information about a website or a collection of documents into a single file. This can also work similarly for API documentation. In essence, it fills the same role for agents that a well-written README does for people.
Octopus serves its own file at https://your-octopus-server/llms.txt. As of the time of this writing the file is about 400 KB of Markdown and has 5 sections:
| Section | What it contains |
|---|---|
| Authentication | API keys, the X-Octopus-ApiKey header, cookie login, and cross-site request forgery (CSRF) protection |
| Space selection | The 2 URL prefix forms, /api/Spaces-1/... and /api/spaces/default/... |
| Endpoints | Documented routes grouped by resource, with query parameters, request body type, and response type |
| Types | One line per type listing its properties and their child types |
| Steps and their properties | Every ActionType with its Octopus.Action.* property keys, defaults, and allowed values |
A typical endpoint line then looks like this:
- `POST /deployments` - Create a Deployment | Prefixes (pick one): `/{spaceId}`, `/spaces/{spaceIdentifier}` | Body: CreateDeploymentCommand → DeploymentResourceAnd the matching type line describing the underlying types:
CreateDeploymentCommand: SpaceId (string), ReleaseId (string), ChannelId (string), DeploymentProcessId (string), EnvironmentId (string), TenantId (string), ForcePackageDownload (boolean), ...Together, these lines give the agent an endpoint and the fields for its request body. It can search for POST /deployments, find the matching type definition, and construct a request.
The Steps section is particularly useful. To build a deployment process through the API, for example, the agent needs to know that a script step uses the ActionType value Octopus.Script and stores its script in Octopus.Action.Script.ScriptBody. The Steps section provides these property keys alongside the API information derived from our existing Swagger docs.
Why is this useful? The llms.txt file gives agents a succinct overview of everything available in the Octopus API, making it easy to build:
- Custom views ands dashboards
- Automation scripts
- Custom integrations with Octopus
Part 1: Seeding realistic data
First, I wanted to fill my Octopus instance with data. I started with an almost empty space: one project, 3 environments, no tenants, no targets. The prompt was:
Use the Octopus API to create test data. Projects with deployment processes, fake targets, project variables, tenants, and anything else you can think of. Make the projects look realistic.
The agent fetched llms.txt, searched the sections it needed, and wrote a small Python helper for calling the API securely (to avoid pasting the API key in the agent’s logs):
def call(method, path, body=None):
    req = urllib.request.Request(BASE + "/" + SPACE + path, data=json.dumps(body).encode() if body else None, method=method)
    req.add_header("X-Octopus-ApiKey", KEY)
    req.add_header("Content-Type", "application/json")
    with urllib.request.urlopen(req) as r:
        return json.loads(r.read().decode())
The agent created a fictional company called Harborline, with 5 teams running a platform for retailers. Each retailer is represented as a separate tenant. It then seeded the instance with the deployment processes, runbooks, variables, deployment targets, etc.
How the llms.txt file helped
Here are some examples of where llms.txt was useful for my agent:
- Space prefixes. The agent could understand the Spaces scoping concept and apply the correct URL prefixes to the API calls, like
/api/Spaces-1/.... - Deployment process authoring. Keyed step properties like
Octopus.Action.TargetRoles,Octopus.Action.RunOnServer, andOctopus.Action.Manual.ResponsibleTeamIdswere documented in the file and the agent used those to create the deployment processes. - Backdating releases.
CreateReleaseCommandhas an optionalAssembledfield. The agent used it to spread 31 releases across August and September so the dashboards would have history to show. - Breadth of the API. As Octopus Deploy is an API-first product, the agent was able to understand what Octopus is and what it offers just by reading the available API endpoints.
While the text file gave the agent enough ground to start, there were still issues where it had to make requests to the API first to understand the right shape of things. The agent worked through these issues by making API requests and reading back the detailed error and validation messages.
Part 2: Custom dashboards
One of the best scenarios for using the Octopus REST API directly is creating customized dashboards tailored to your specific requirements. This is much easier to achieve now that you can just point your coding agent to the llms.txt and ask it to build it for you.
Keep the API key out of the browser
To avoid embedding your API key into the dashboard, you can use a small proxy script. The proxy serves the static HTML and forwards requests under /api/ to Octopus, adding the API key header. This gives the browser a single origin for both the page and its API requests, solving Cross-Origin Resource Sharing (CORS) issues.
Here’s is an example that forwards a request:
def proxy(self):
    req = urllib.request.Request(OCTOPUS_URL + self.path)
    req.add_header("X-Octopus-ApiKey", API_KEY)
    with urllib.request.urlopen(req) as r:
        body = r.read()
    self.send_response(200)
    self.send_header("Content-Type", "application/json")
    self.end_headers()
    self.wfile.write(body)
Now here are some examples of the dashboards you could build.
The tenant rollout board
The first dashboard is a matrix. Tenants are rows, grouped by any tenant tag set. Projects are columns, grouped by team. Each cell shows the release a tenant is running in the selected environment, and how many releases behind the newest one it is.
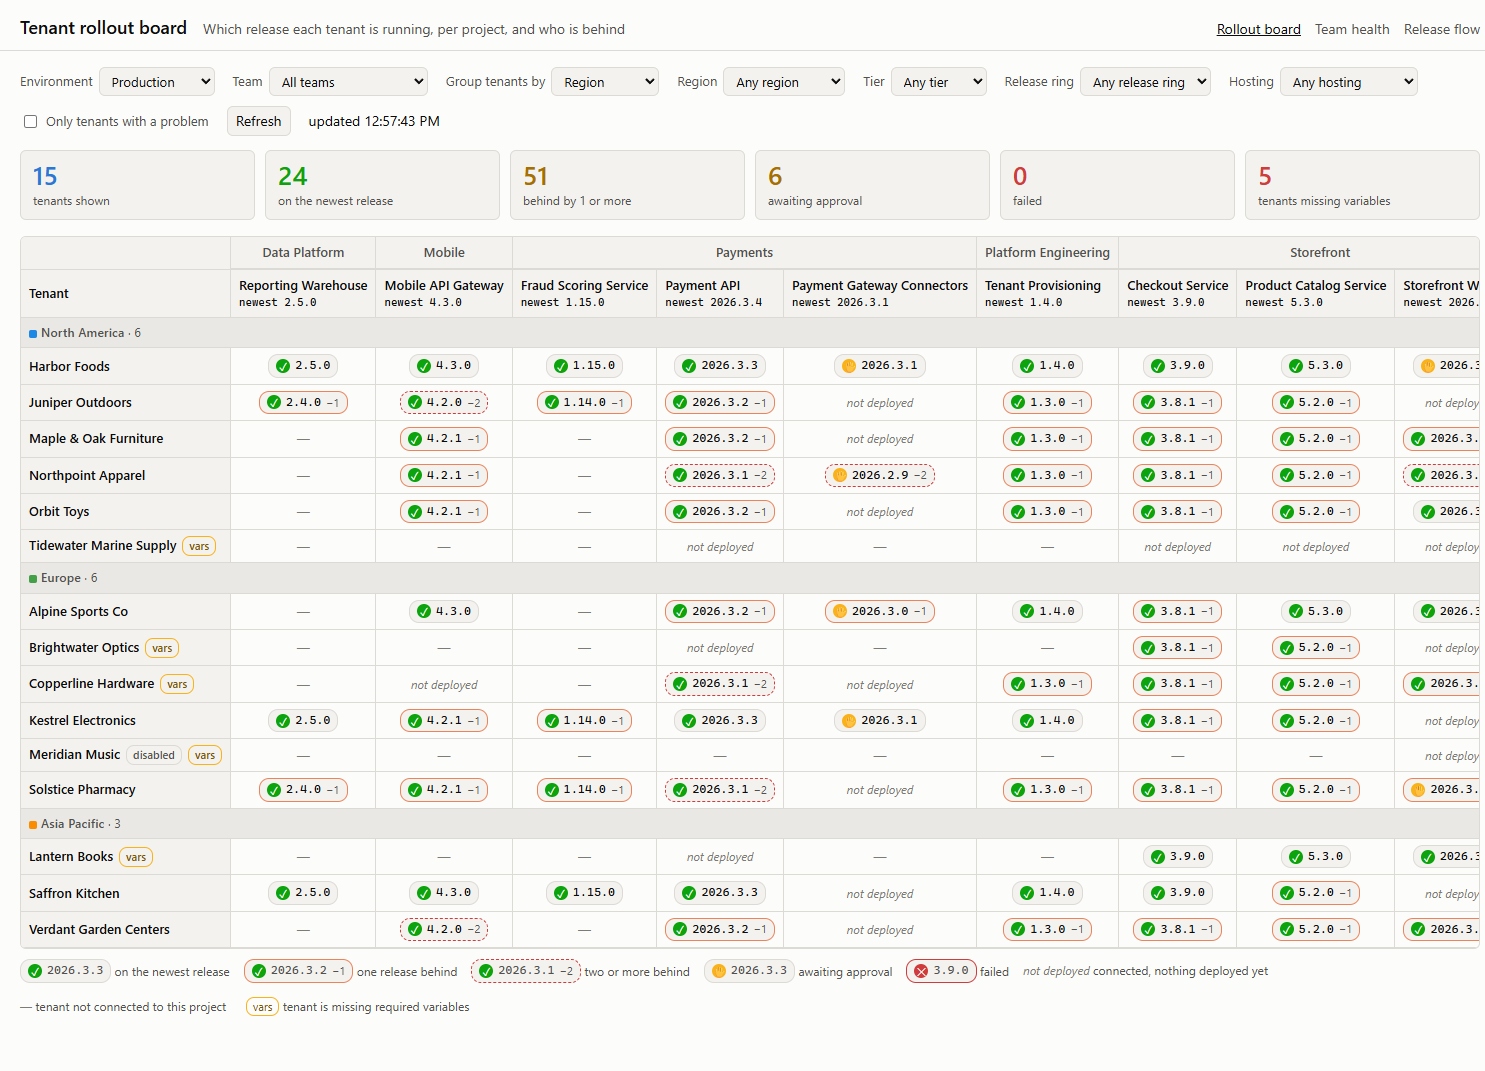
The board uses these endpoints:
| Endpoint | Used for |
|---|---|
GET /dashboard?showAll=true | Current deployment per project, environment, and tenant, plus projects, tenants, and environments in one call |
GET /projects/{id}/releases | The newest release per project and per channel, to work out how far behind a tenant is |
GET /tagsets/all?scopes=Tenant | Tag sets for grouping and filtering |
GET /tenants/variables-missing | Tenants that cannot be deployed to because a required variable has no value |
GET /interruptions?pendingOnly=true | Deployments paused for approval |
The board calculates how far behind a tenant is in its channel, such that a tenant on the latest hotfix isn’t flagged as behind the mainline.
The summary tiles highlight where a release manager needs to act. In this example, 51 tenant deployments are behind the latest release in their channel, and 5 tenants have missing variables. Selecting Only tenants with a problem narrows the board to the affected tenants.
The team health board
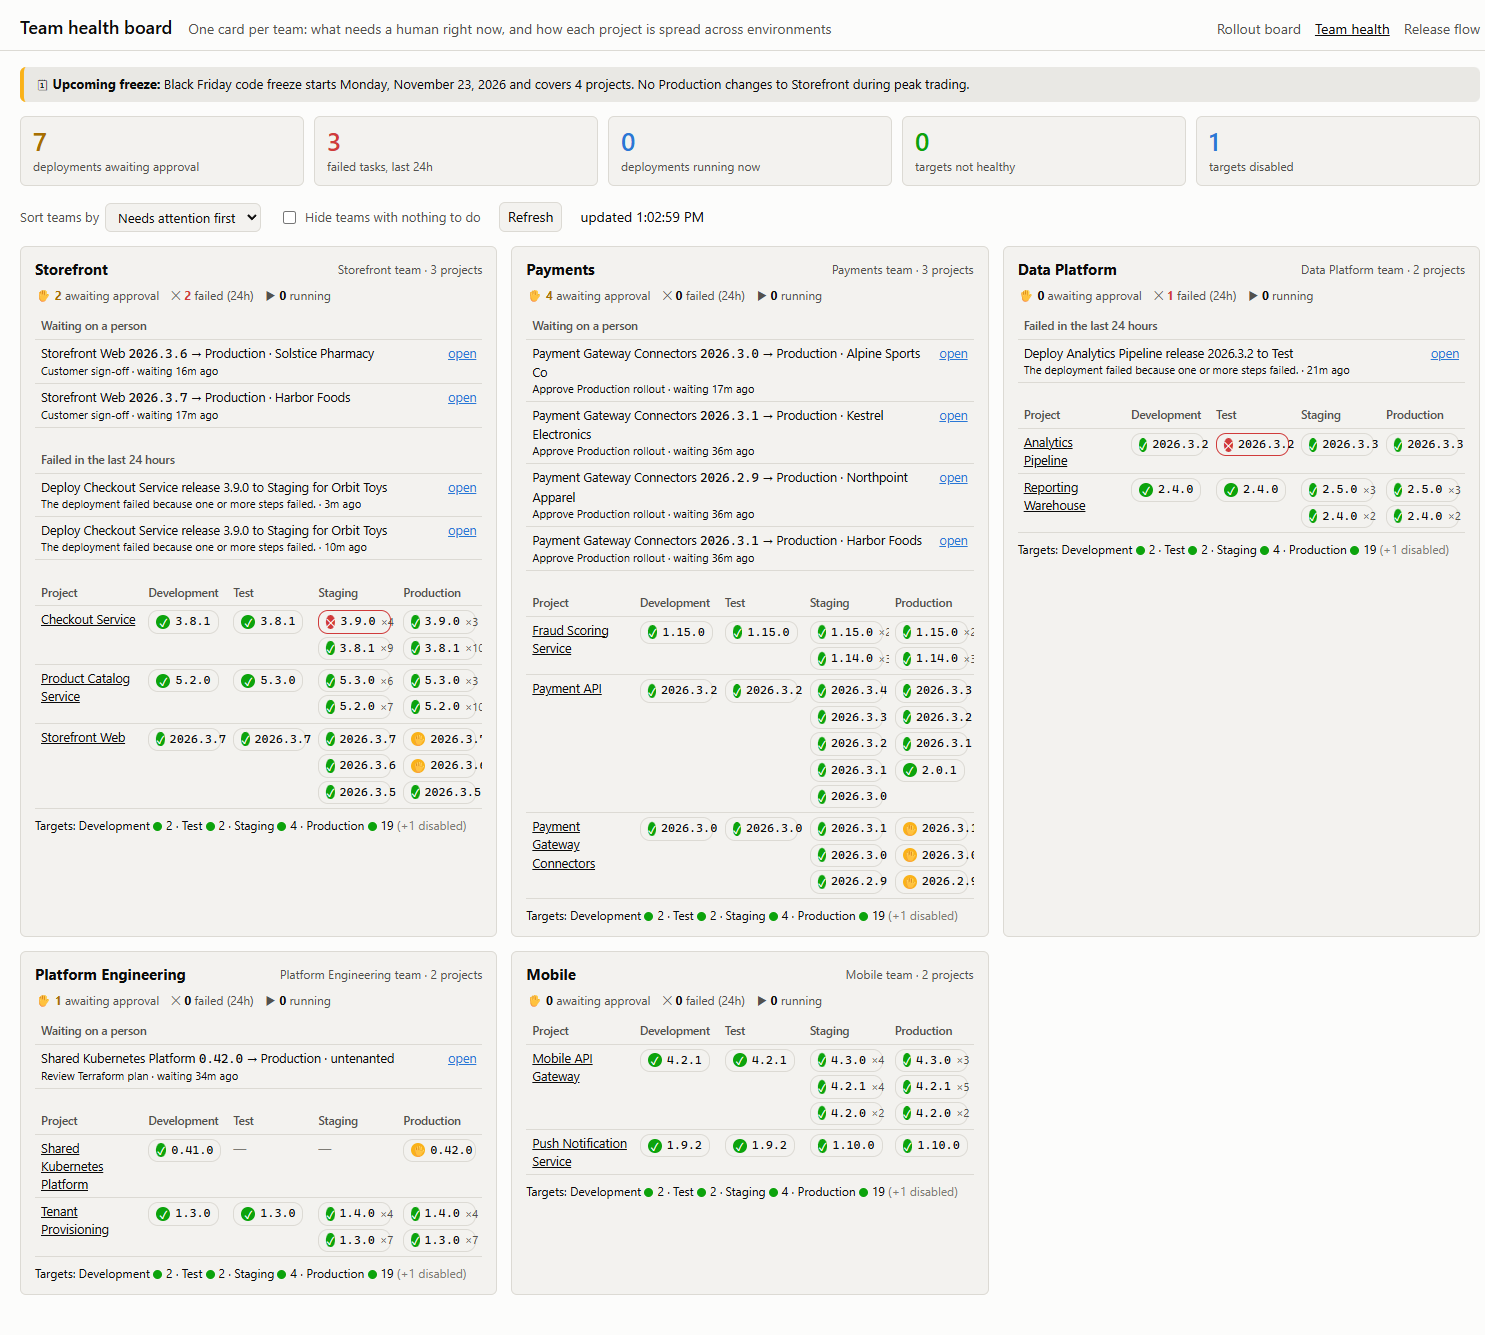
The second dashboard groups work by team, with one card for each. Each card starts with deployments waiting for approval and tasks that failed in the last 24 hours. Every item links to its task in Octopus, so you can go back to the Octopus UI at any point.
Below these items, a table shows each project’s releases across environments. Version labels like 2026.3.3 ×5 summarize tenanted deployments. The footer shows target health by environment, and a banner at the top of the dashboard shows active or upcoming deployment freezes.
| Endpoint | Used for |
|---|---|
GET /dashboard?showAll=true | Current deployments and the project group for each project |
GET /interruptions?pendingOnly=true | Pending approvals |
GET /tasks?states=Failed,TimedOut&fromCompletedDate=... | Failures in the last 24 hours |
GET /machines/all | Target health and deactivated targets |
GET /teams/all | Mapping project groups to the team that owns them |
GET /deploymentfreezes | Active and upcoming freezes |
The agent sorted the cards by an attention score: 3 points per failure, 2 per pending approval. The team with the highest score appears at the top left.
Part 3: A release flow diagram
And for the last one, just for fun, I asked the agent:
Use the API via llms.txt to create one other custom dynamic HTML representation of Octopus data in a creative way, perhaps a visualization.
The agent chose a Sankey diagram, which uses ribbons to show connections between groups. Here, the ribbons connect a project’s releases to their current environments and the tenants or tenant groups they serve.
Ribbon width represents the number of tenants. You can color the ribbons by release to follow a version across the diagram, or by deployment state to highlight failures and pending approvals.
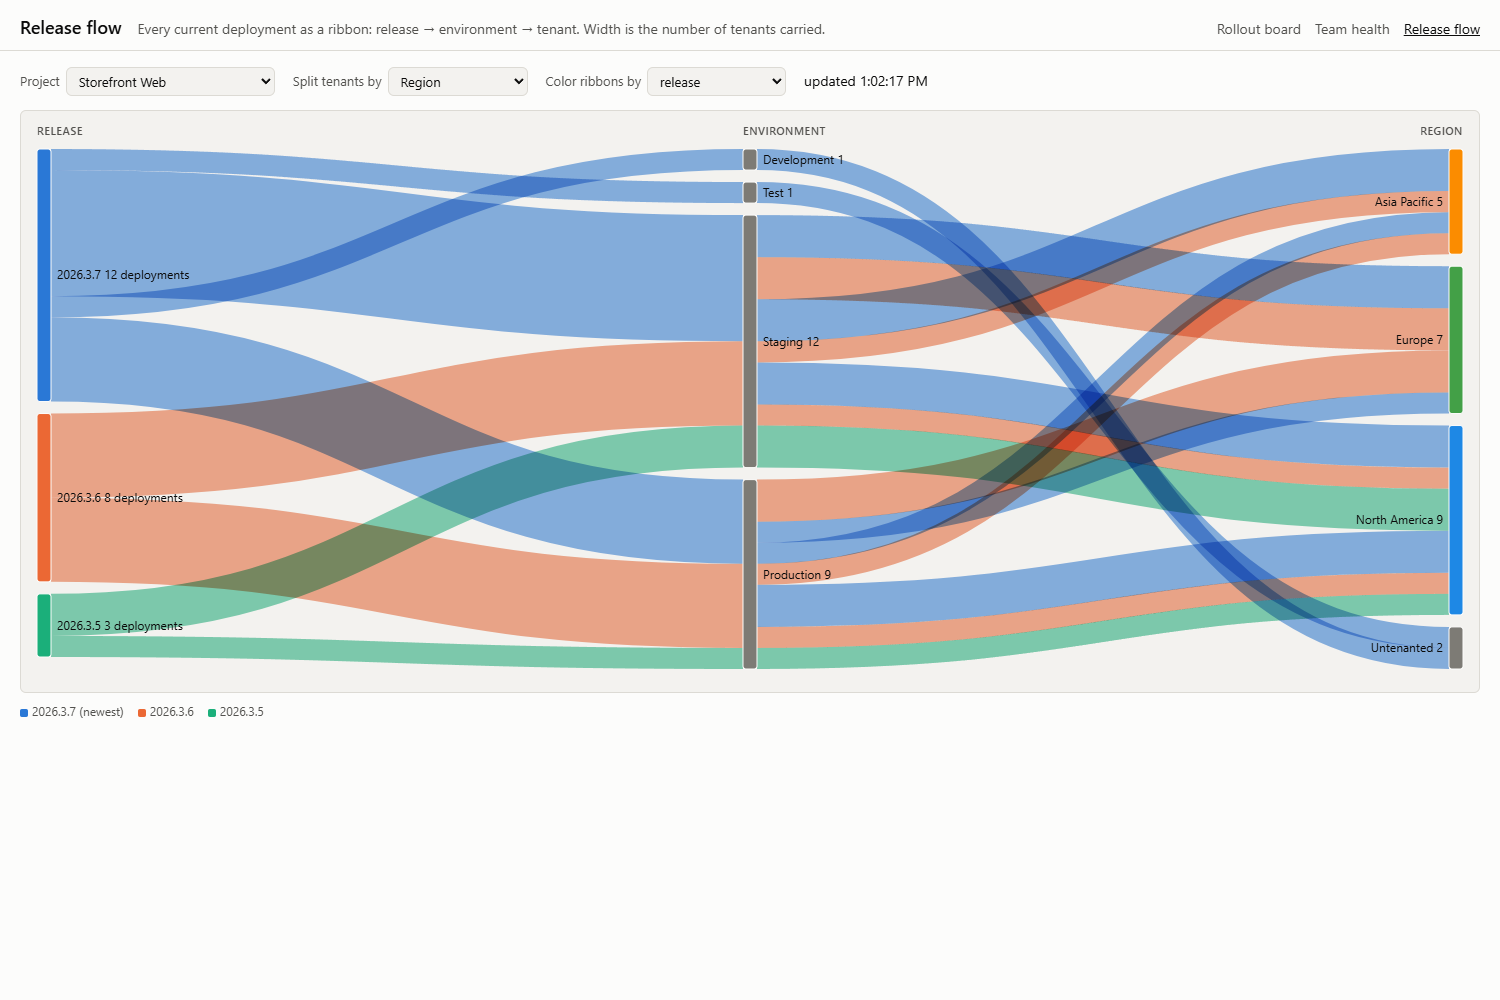
With this you could easily create interactive charts that help you analyze a complex matrix of deployments to spot trends and anomalies.
Try it yourself
You will need a publicly accessible instance of Octopus, an agent API key, and a coding agent that can fetch URLs and run scripts.
- Open
https://your-octopus-server/llms.txt(orhttps://your-octopus-server/api/experimental/llms.txt) in a browser to confirm your version serves it. - Give your agent the URL and an API key with permissions scoped to a test space. Ask it to fetch the file before doing anything else.
- Start with a read-only task, like “list every tenant that is more than one release behind in Production.” Check the answer against the portal.
- Move on to writing the real code. When the agent makes a mistake, the API response will explain why. Use this loop to build the functionality you want.
Keep the API key on the server side. If you build dashboards, create a service account, and put a proxy between the browser and Octopus, like the one above. Never paste the key into the page source. If you are using an external authentication provider, you could also extend this to use a proper authentication mechanism rather than just an API key, though the implementation could become quite complex.
Happy deployments!