Your continuous deployment platform already knows exactly who changed what, and when. If someone edited a variable or deleted an environment, Octopus records all of it.
For most teams, centralizing audit logs in the same SIEM tool they already watch is more than an added advantage, it is a compliance requirement, and “audit log to SIEM” stays a busy search term precisely because so many tools make it harder than it should be.
In this guide you will stream Octopus audit events into Grafana Cloud over OpenTelemetry, query them with LogQL, and fire a Slack alert the moment something is deleted.
Because the transport is OpenTelemetry, you can take what you learn here and stream the same events to any OpenTelemetry destination, whether that is Datadog, Honeycomb, Elastic, or a self-hosted collector.”
Where Octopus audit data lives
Octopus gives you three ways to reach audit data, and it helps to know which one you are reaching for.
- The Audit tab (Configuration, then Audit) is the in-product view. It is great for browsing individual events, filtering by user or date, and expanding a single change to see exactly what was modified.
- The Audit Stream pushes those same events out to an external system as they happen. This is the path this article covers. It supports OpenTelemetry (OTLP) alongside direct integrations for Splunk and Sumo Logic.
- Compliance Reports, also in Platform Hub, are the purpose-built path for Governance, Risk, and Compliance (GRC) reporting. If your primary need is producing GRC evidence rather than raw log search, that is where to look. It complements the streaming setup here rather than replacing it.
In other words, the Audit tab and Audit Stream give you the raw events, and Compliance Reports streamline the reporting on top.
Architectural overview
Before we hop into a demo, It is worth getting a grasp on how this will all work.
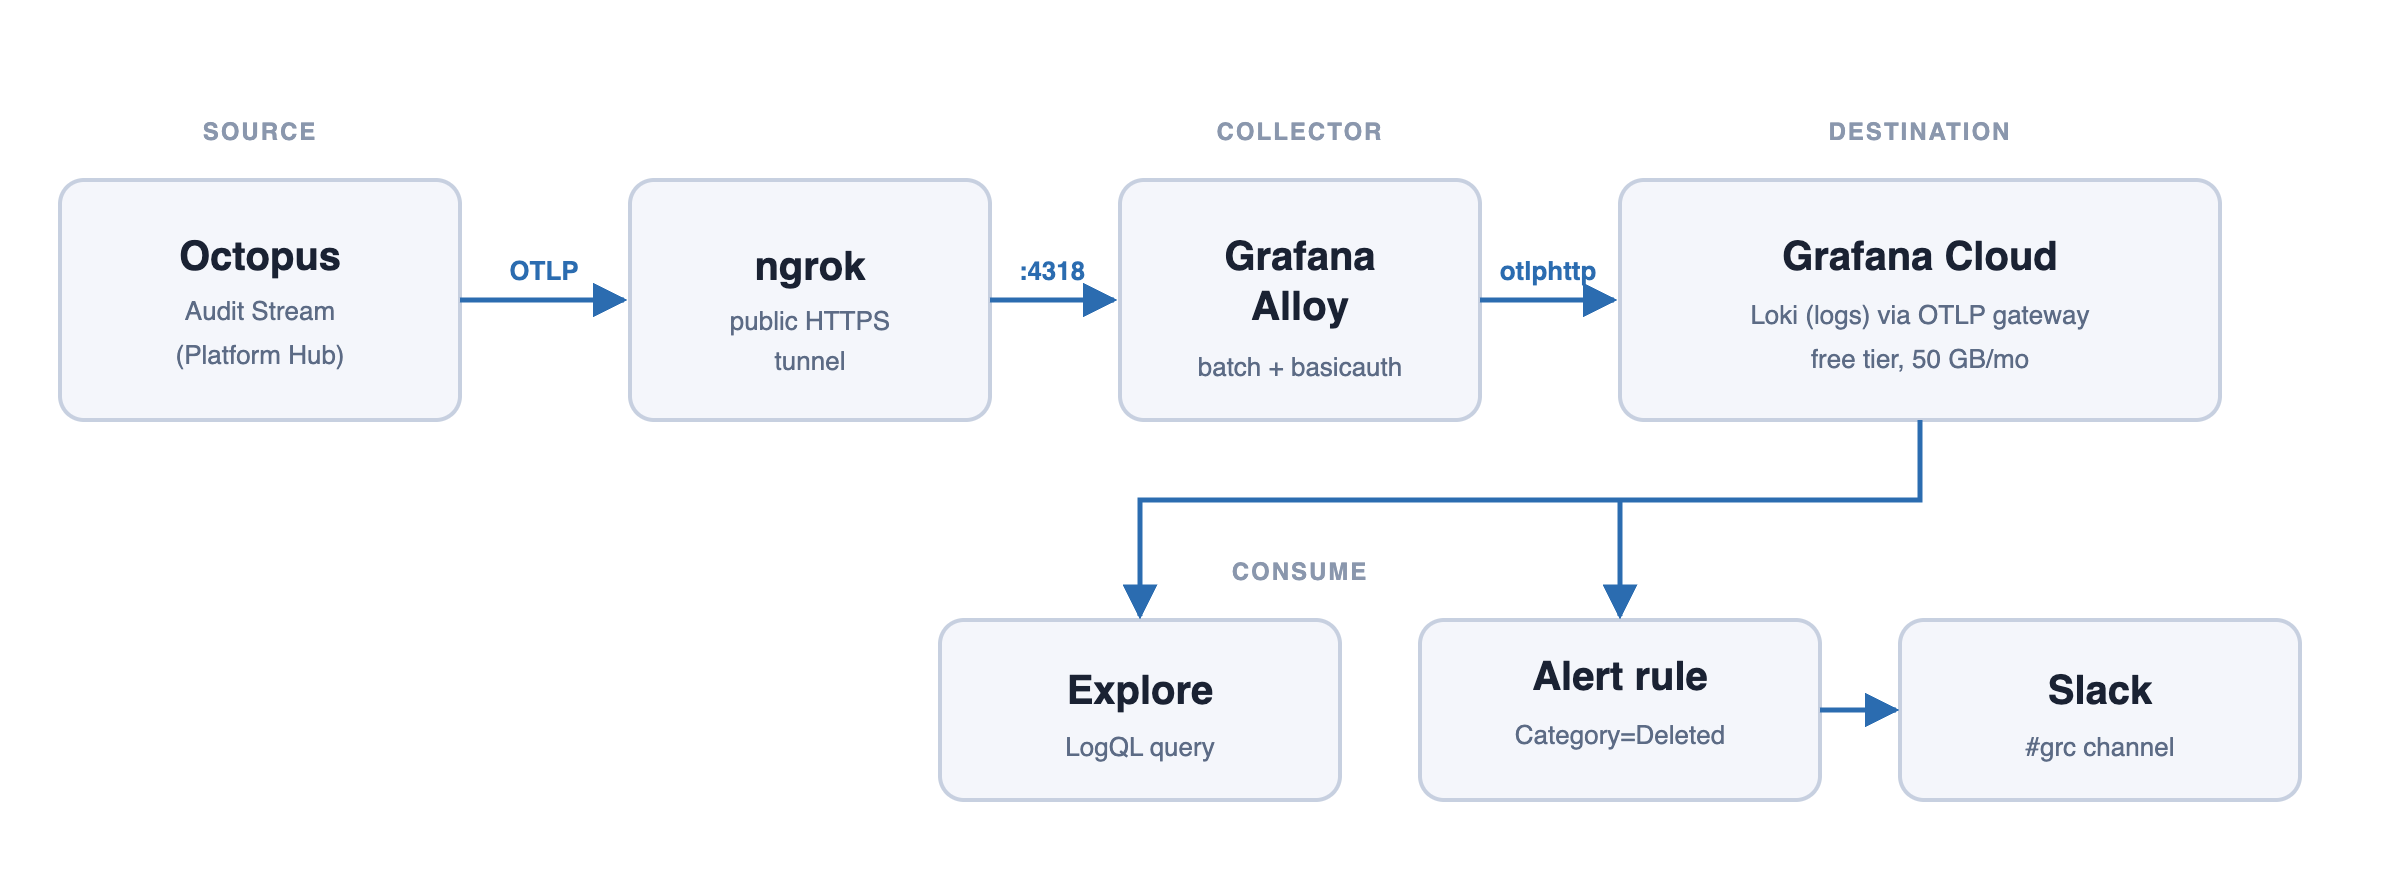
Fundamentally, Octopus emits audit events over OTLP. A collector receives them and forwards them to Grafana Cloud, where they land in Loki and become queryable in Explore. From there, an alert rule watches for events and notifies Slack.
Prerequisites
- An Octopus instance with the Audit Stream available.
- A free Grafana Cloud account.
- Grafana Alloy, the OpenTelemetry Collector distribution Grafana recommends, running as the receiver and forwarder.
You might ask, “why put a collector in the middle instead of pointing Octopus straight at Grafana Cloud?” Simple. For reliability and control.
The collector batches records, holds the Grafana Cloud credentials in one place, and gives you a single spot to add processing or route to a second backend later. It also keeps Octopus configuration simple: Octopus only ever talks to the collector.
Step 1: Set up the Grafana Cloud destination
A free tier Grafana Cloud account includes 50 GB of log ingestion per month with 14 days of retention, which is plenty for an audit trail demo.
Once your stack exists, open the connection details for the OTLP endpoint. In the Grafana Cloud portal, go to your stack and find the OpenTelemetry tile, or open the stack’s OTLP connection page directly.
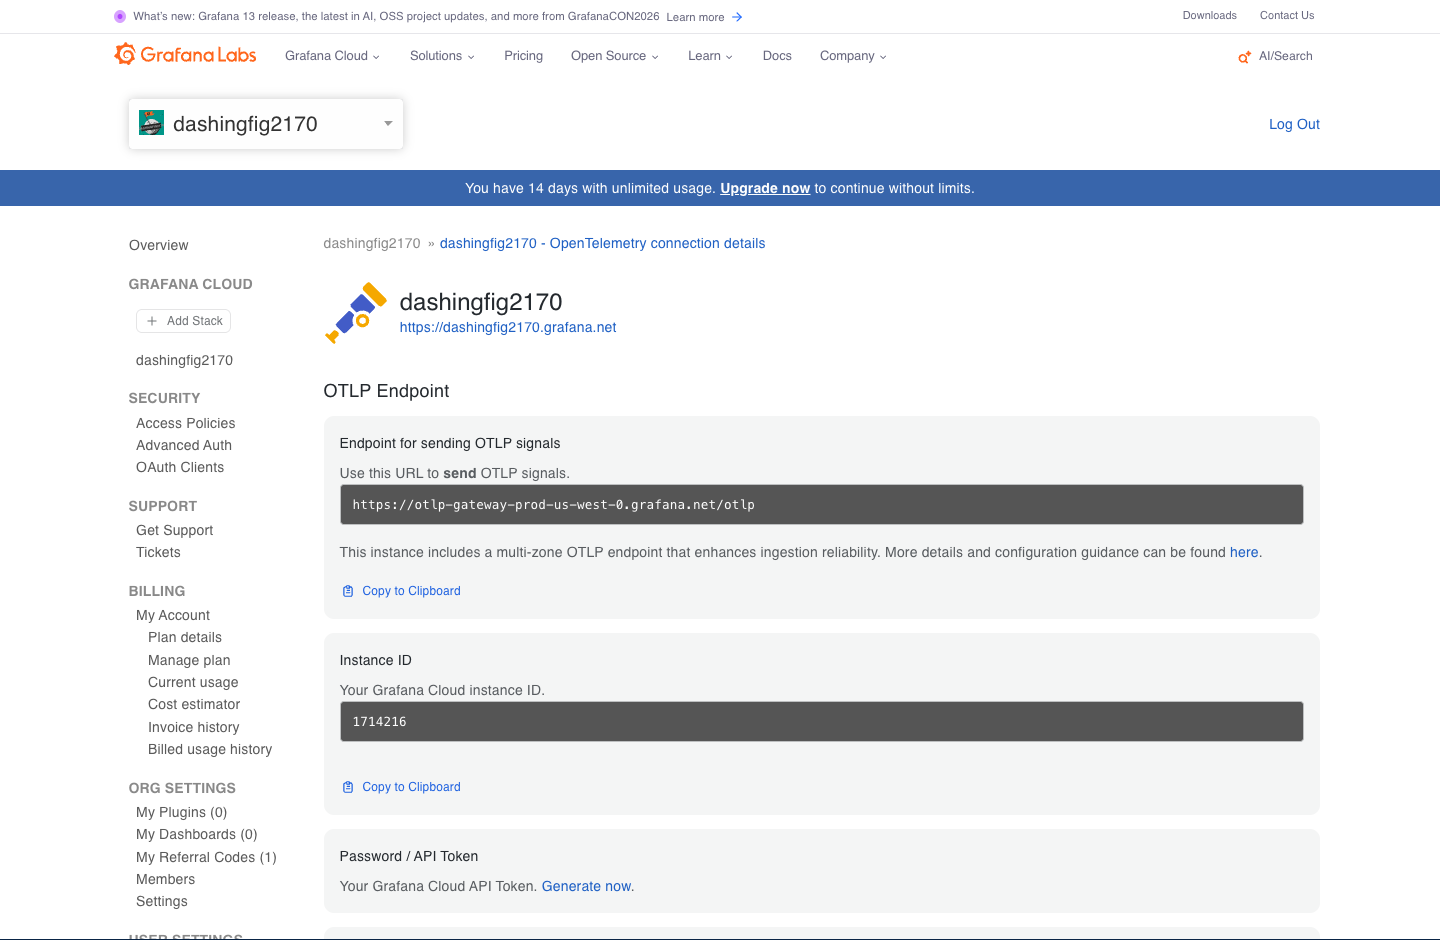
You are after the following three values:
- OTLP Endpoint, something like
https://otlp-gateway-prod-us-west-0.grafana.net/otlp. The region in that hostname will match your stack. - Instance ID, a numeric value such as
1714216. This is the username half of the credentials. - API Token. Click Generate now, give the token a name like
octopus-audit-stream, keep the default scopes (which includelogs:write), and create it. Copy the token, it is shown only once. This is the password half.
Logs sent over OTLP land in Loki. Grafana Cloud promotes the OpenTelemetry service.name resource attribute to the Loki stream label service_name, which is how you will find the data later. Octopus sets this to Octopus Deploy, so your query will start with {service_name="Octopus Deploy"}.
Step 2: Configure the OpenTelemetry collector (Grafana Alloy)
In Grafana Alloy, create the configuration file. It does three jobs: receive OTLP from Octopus, batch the records, and export them to Grafana Cloud with basic authentication.
cat > config.alloy <<'EOF'
// 1. Receive OTLP over HTTP (Octopus sends http/protobuf) and gRPC.
otelcol.receiver.otlp "octopus" {
  http {
    endpoint = "127.0.0.1:4318"
  }

  grpc {
    endpoint = "127.0.0.1:4317"
  }

  output {
    logs = [otelcol.processor.batch.default.input]
  }
}

// 2. Batch records before export to reduce request volume.
otelcol.processor.batch "default" {
  output {
    logs = [otelcol.exporter.otlphttp.grafana_cloud.input]
  }
}

// 3. Authenticate to Grafana Cloud with the stack instance ID and API token.
otelcol.auth.basic "grafana_cloud" {
  username = "YOUR_INSTANCE_ID"
  password = sys.env("GRAFANA_CLOUD_API_TOKEN")
}

// 4. Export to the Grafana Cloud OTLP gateway. Logs land in Loki.
otelcol.exporter.otlphttp "grafana_cloud" {
  client {
    endpoint = "https://otlp-gateway-prod-us-west-0.grafana.net/otlp"
    auth     = otelcol.auth.basic.grafana_cloud.handler
  }
}
EOF
Walking through the two values that matter most:
- The exporter
endpointis the OTLP gateway from your connection details - The
otelcol.auth.basicblock is the authentication. Grafana Cloud expects HTTP Basic auth where the username is your instance ID and the password is the API token. ReplaceYOUR_INSTANCE_IDwith the numeric instance ID, and keep the token out of the file by reading it from an environment variable.
Start Alloy with the token in the environment:
export GRAFANA_CLOUD_API_TOKEN='glc_your_token_here'
alloy run config.alloy --storage.path=./alloy-data
Alloy logs that it is listening. You should see the OTLP servers come up:
level=info msg="Starting GRPC server" component_id=otelcol.receiver.otlp.octopus endpoint=127.0.0.1:4317
level=info msg="Starting HTTP server" component_id=otelcol.receiver.otlp.octopus endpoint=127.0.0.1:4318
Confirm the receiver accepts data before wiring up Octopus:
curl -sw "\nHTTP %{http_code}\n" -X POST http://127.0.0.1:4318/v1/logs \
  -H "Content-Type: application/json" \
  -d '{"resourceLogs":[{"scopeLogs":[{"logRecords":[{"body":{"stringValue":"hello"}}]}]}]}'
A HTTP 200 means Alloy took the record. If it also reached Grafana Cloud, you will see it in Explore in a moment.
Expose the collector so Octopus can reach it
Octopus Cloud needs a public URL to send to. For a local test, ngrok is the quickest way to expose the Alloy HTTP receiver, the same technique the Octopus and Elastic walkthrough uses:
ngrok http 4318ngrok prints a public HTTPS URL such as https://4202-12-17-71-220.ngrok-free.app. That, with /v1/logs appended, is what Octopus will target. In a permanent deployment you would run Alloy on a host Octopus can reach directly and skip the tunnel.
Step 3: Point Octopus at the collector
In Octopus, go to Configuration > Audit, and click Stream Audit Log. Choose OpenTelemetry as the provider.
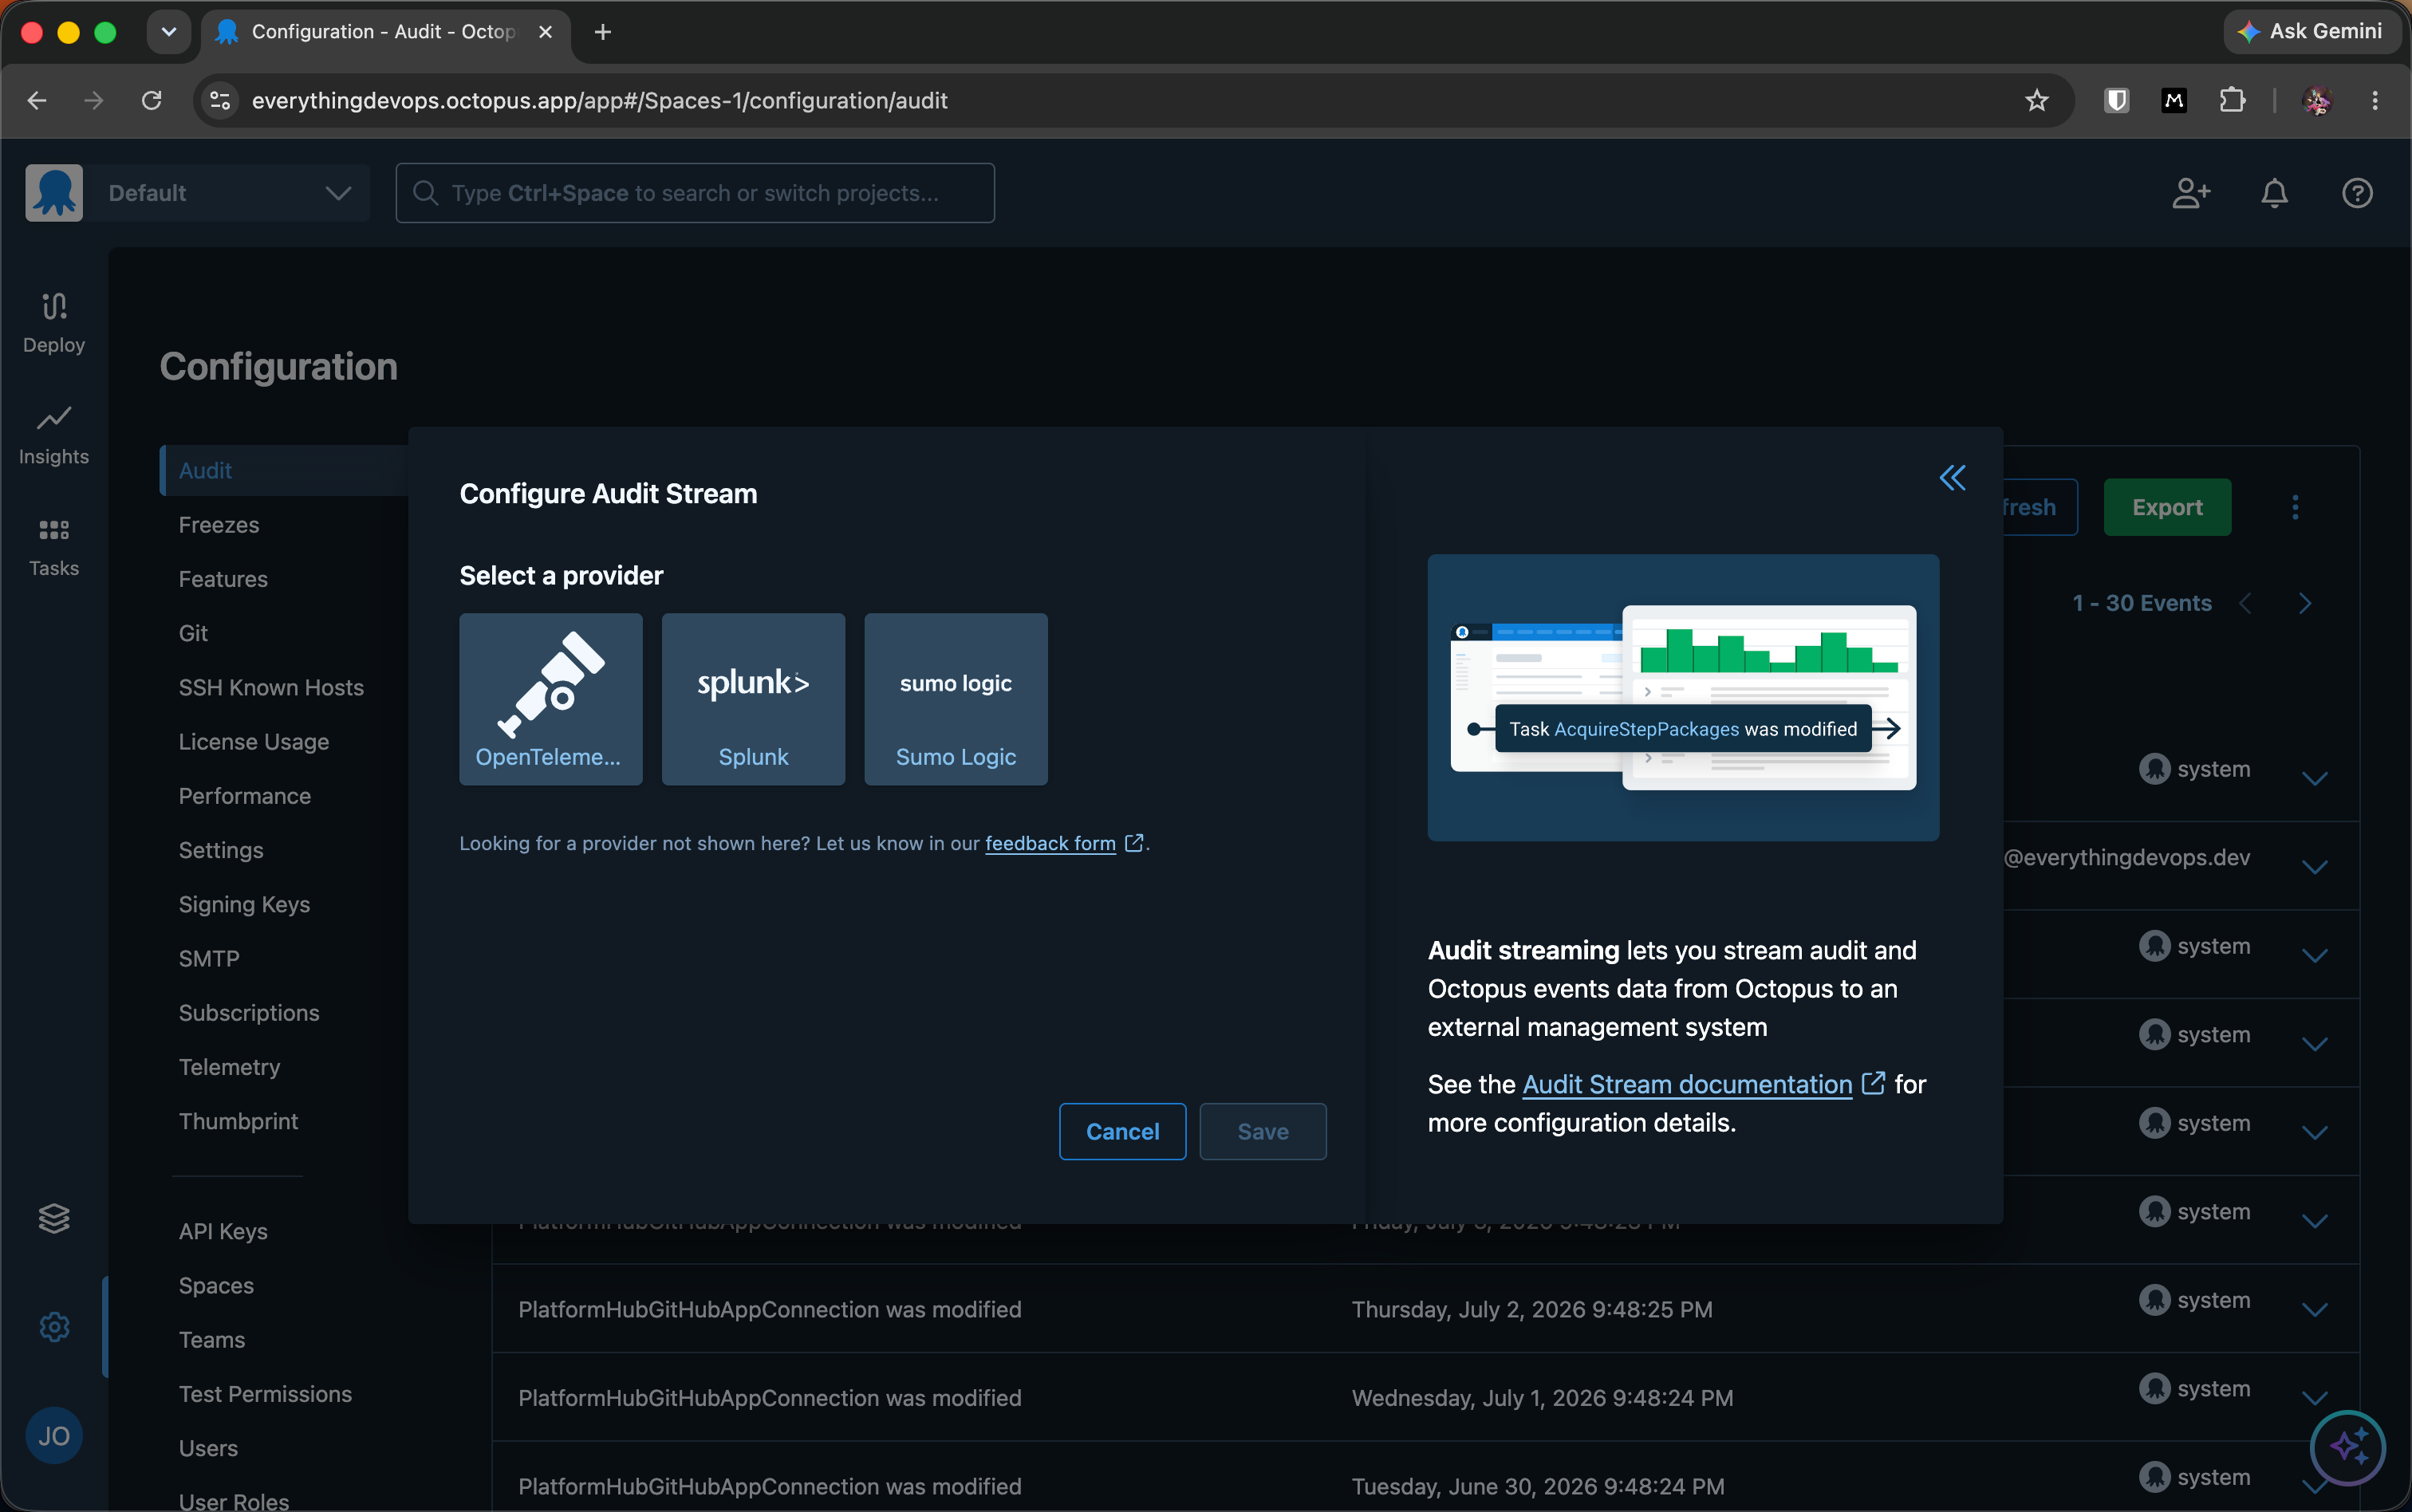
Fill in the OpenTelemetry fields:
- OpenTelemetry Endpoint URL: Your collector’s log endpoint, which is the ngrok URL with
/v1/logson the end, for examplehttps://4202-12-17-71-220.ngrok-free.app/v1/logs. - OTLP Protocol:
HTTP/protobuf. - Secret: Leave this empty. Authentication to Grafana Cloud is handled by the collector, so Octopus does not need to send any token. This is exactly why the collector sits in the middle.
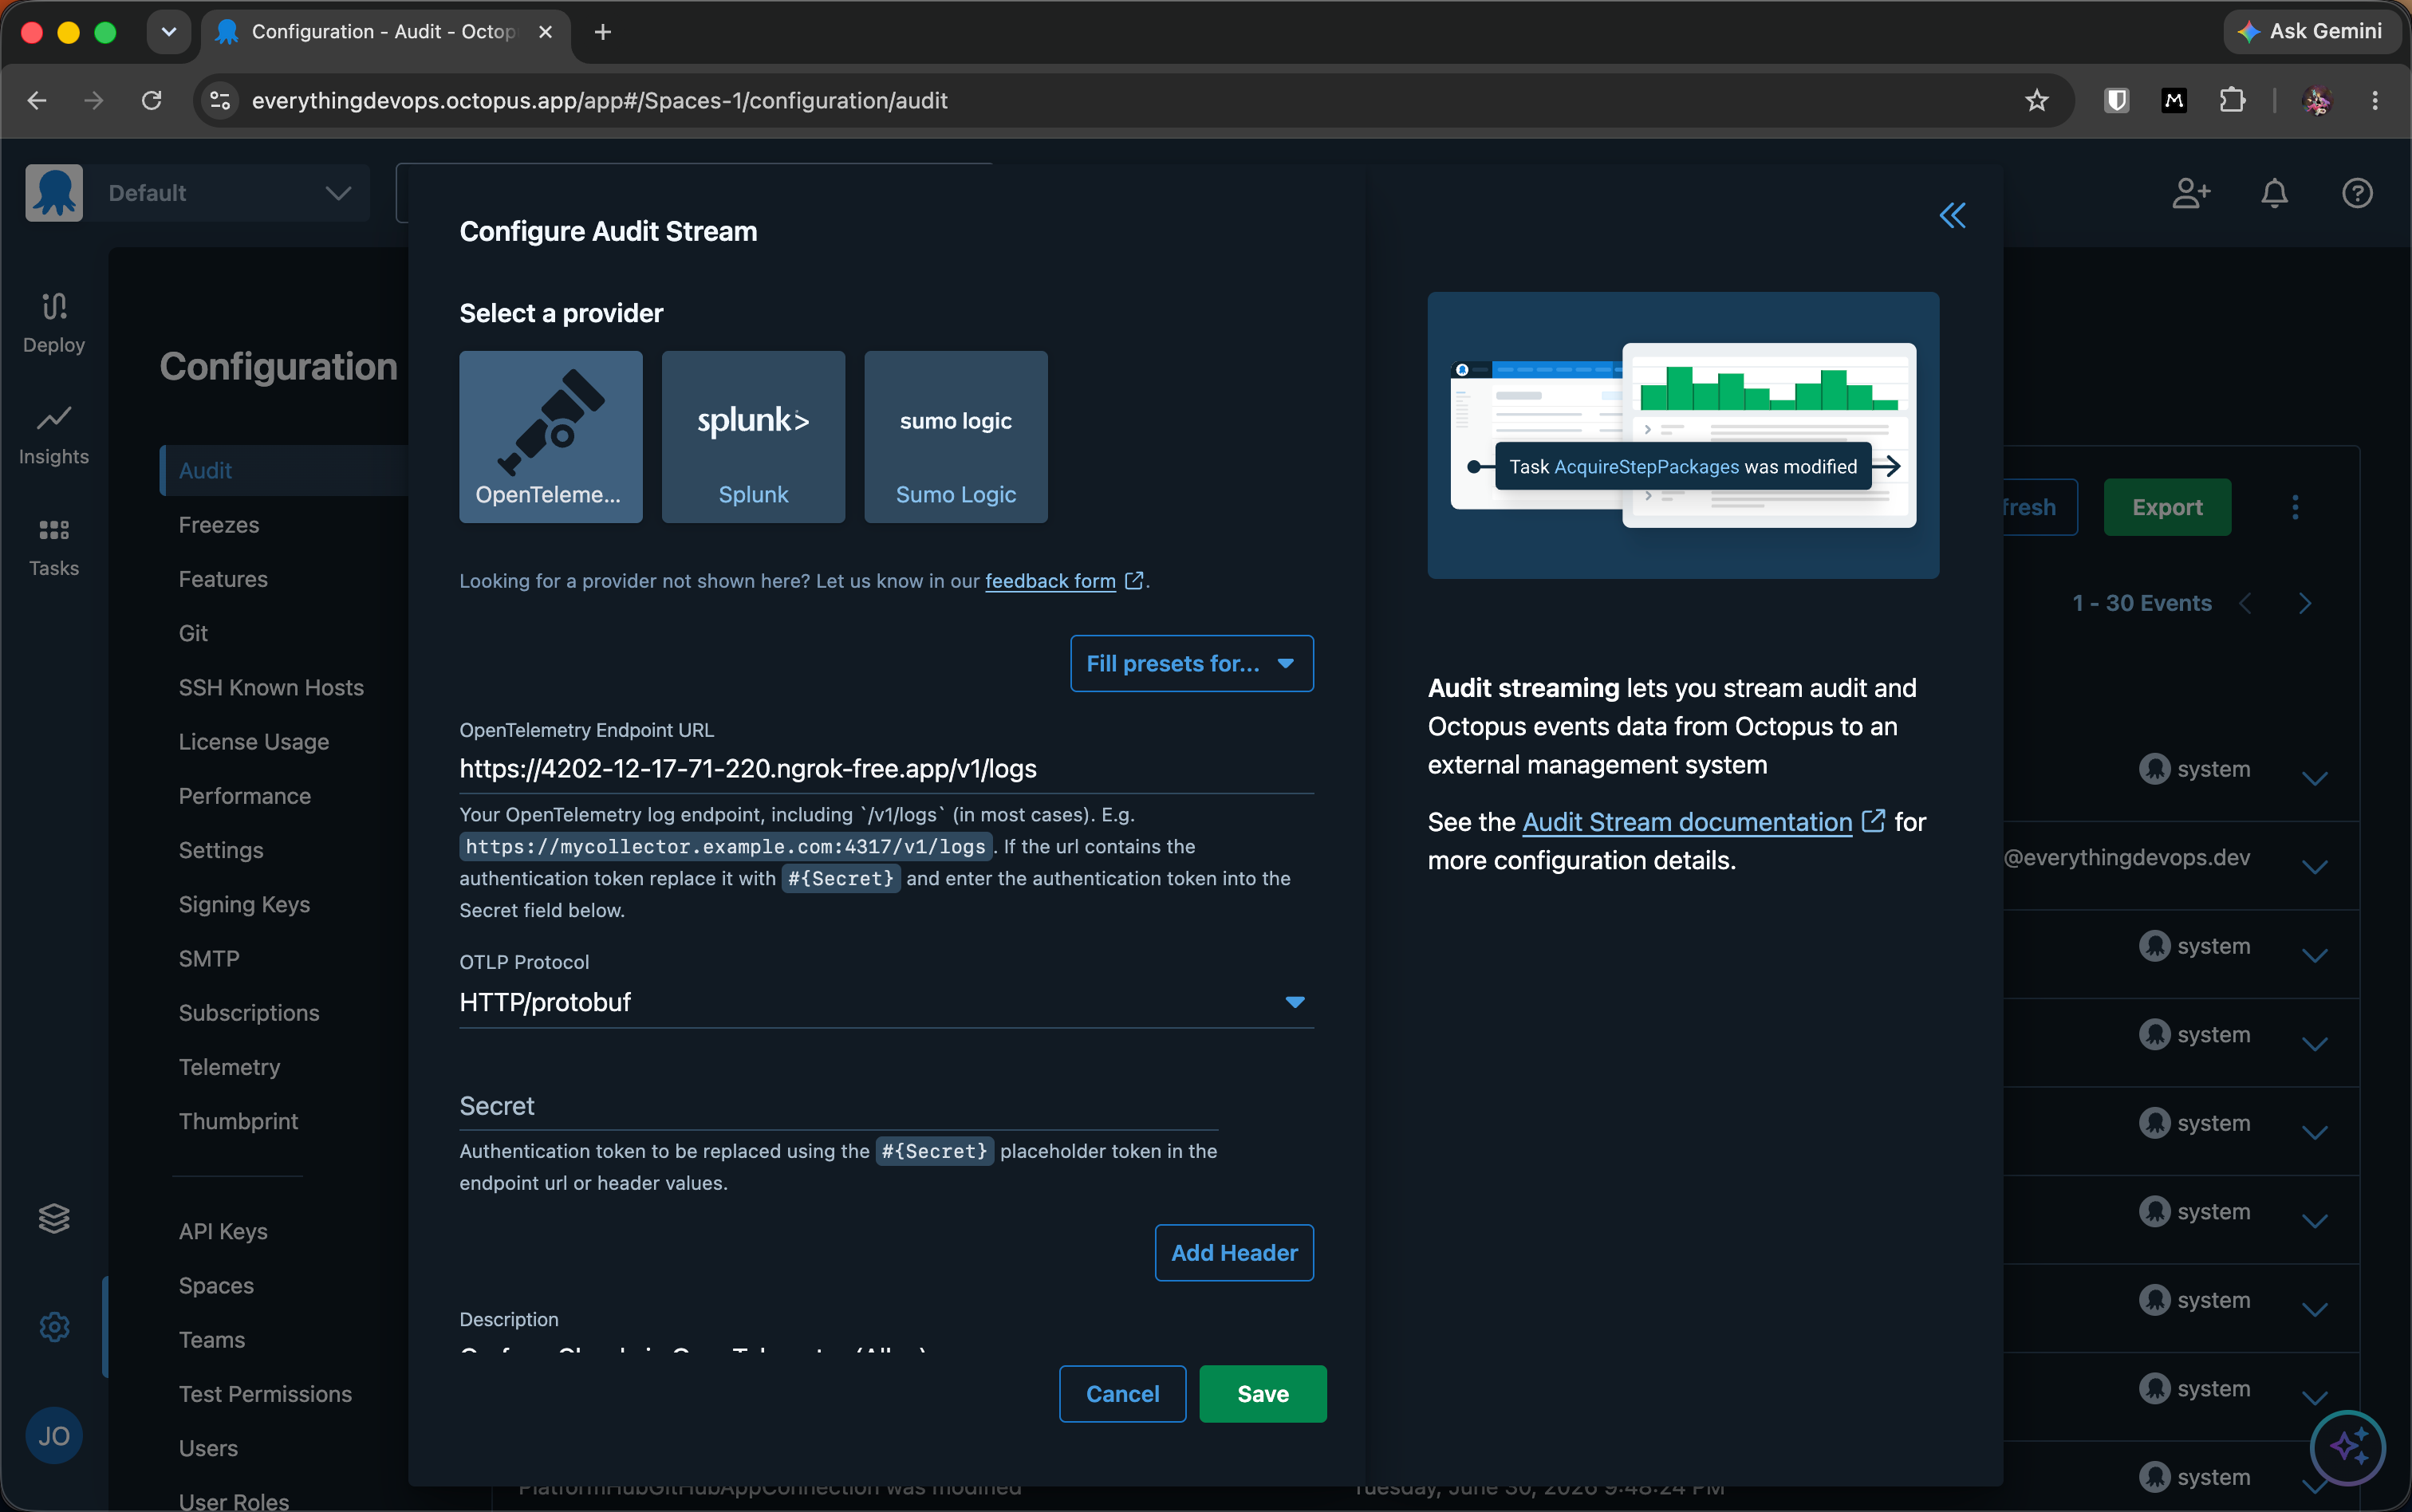
Click Save.
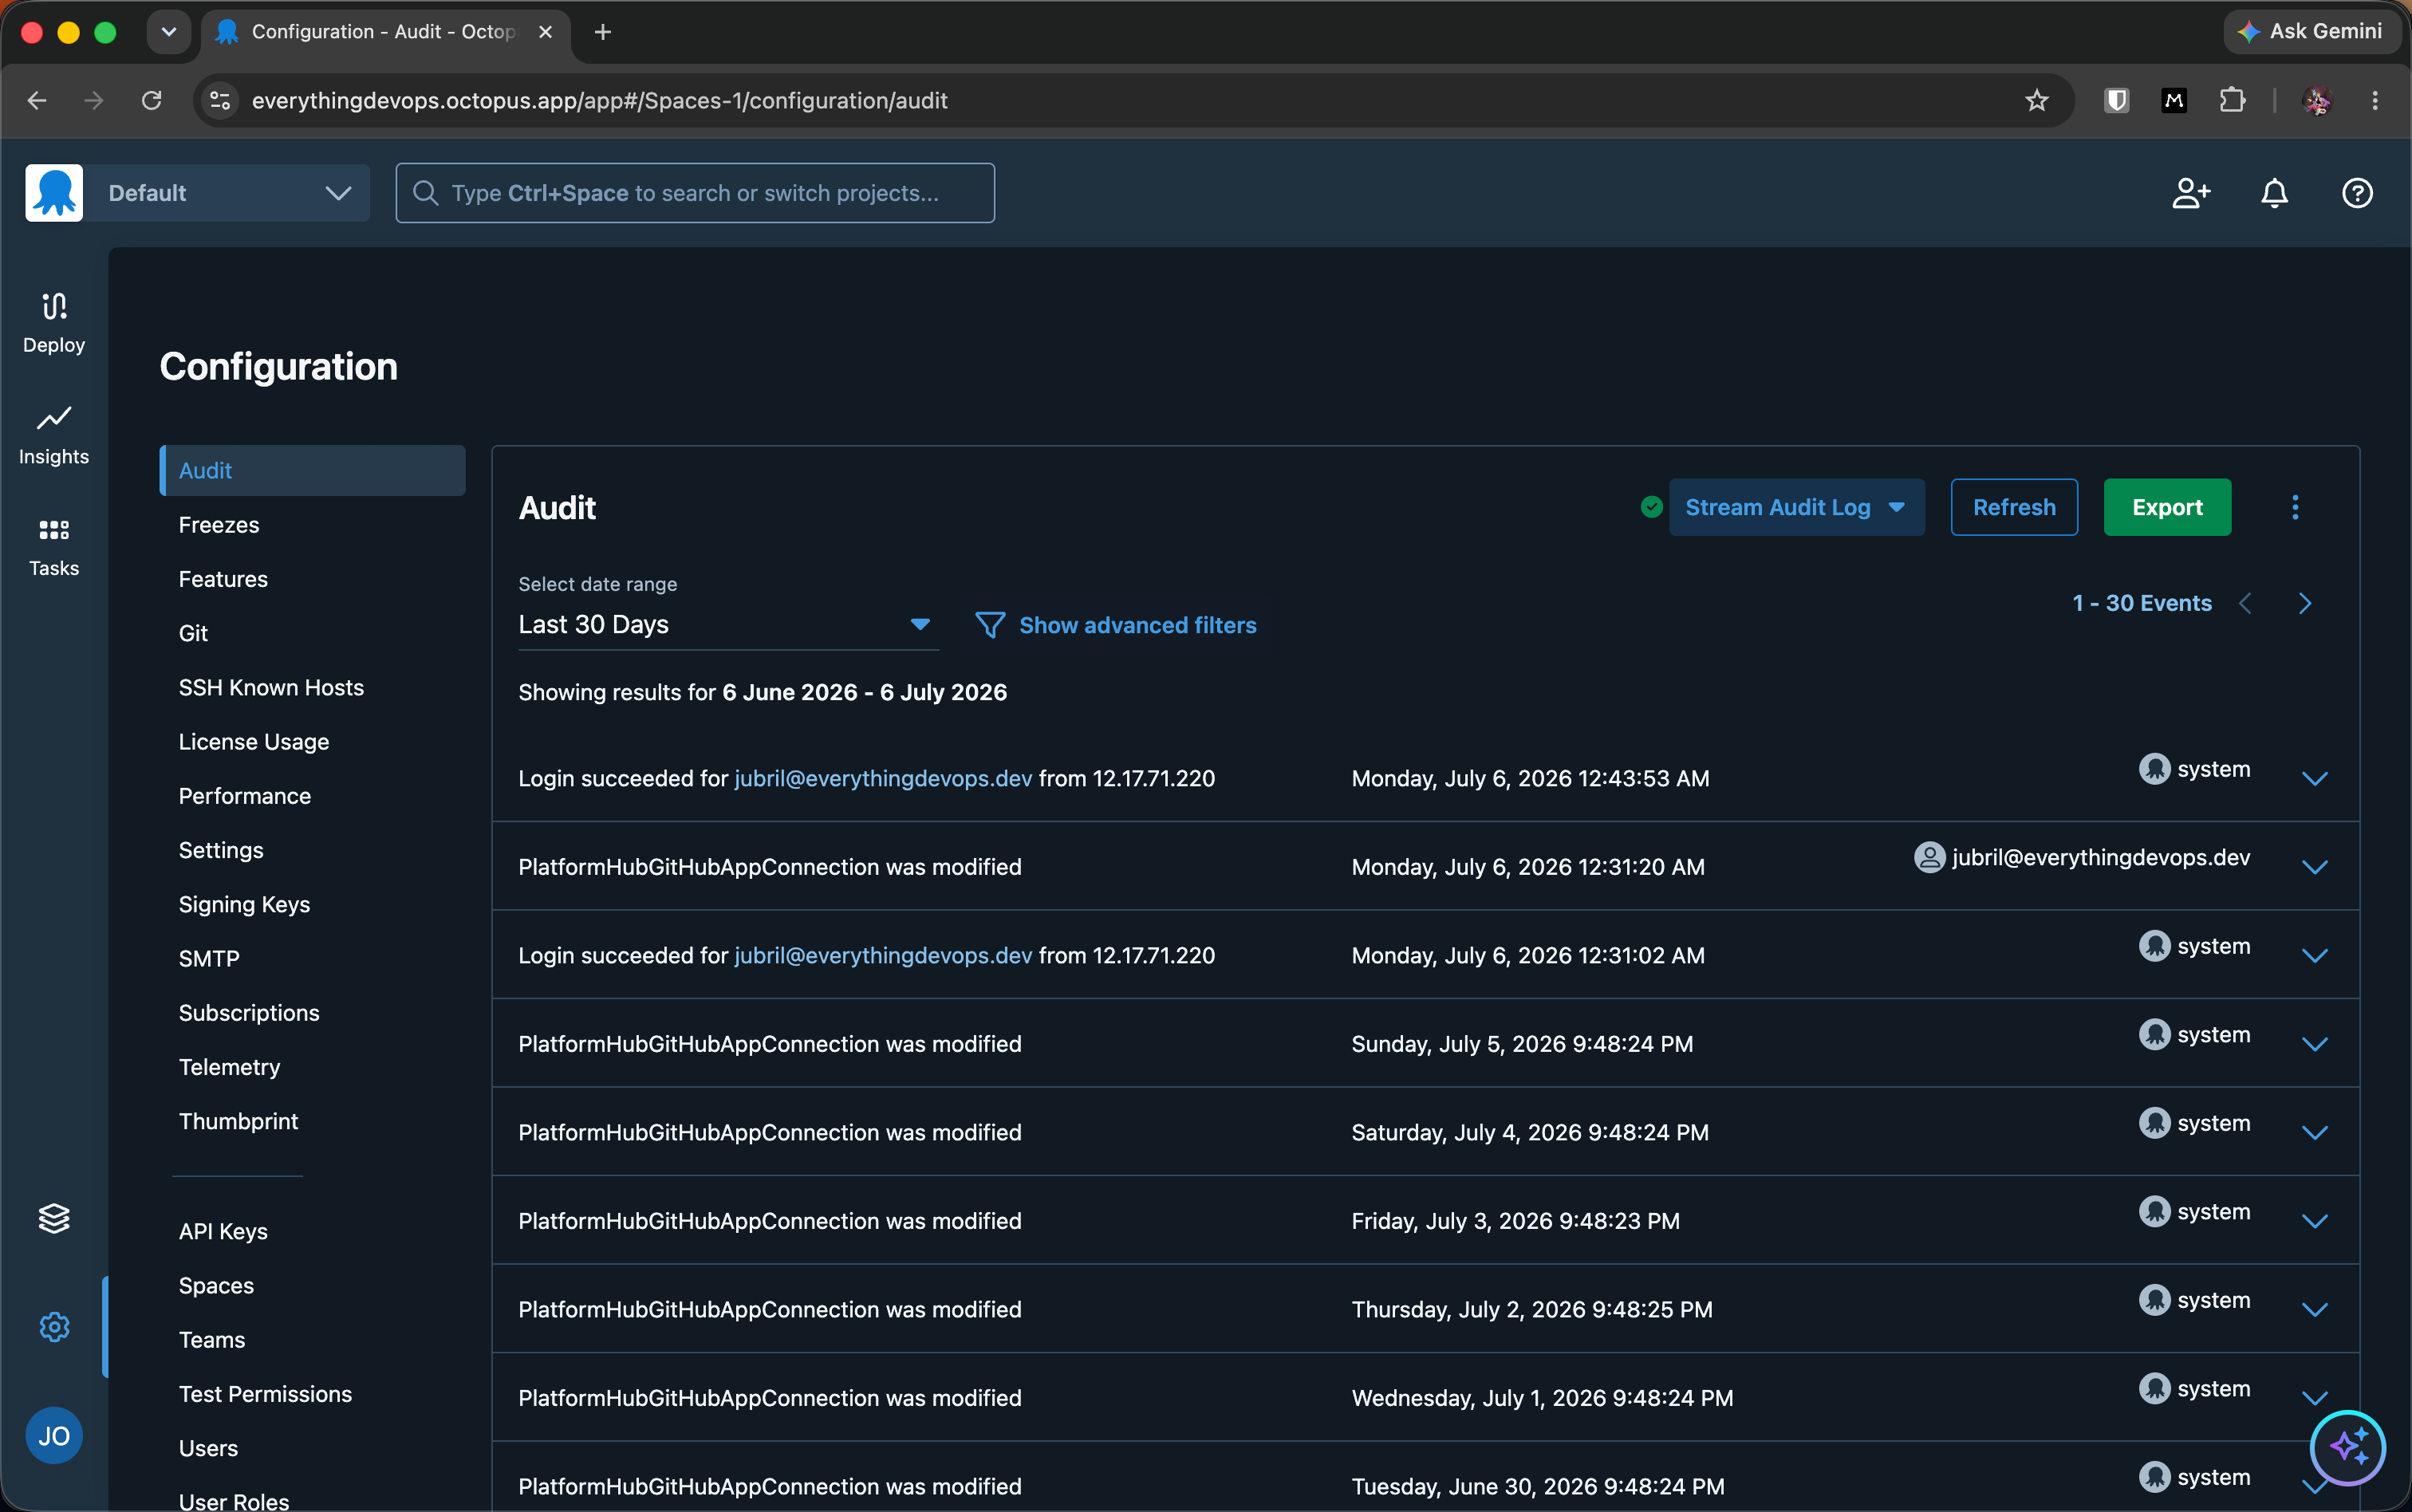
The Stream Audit Log button now shows a green check, which means the stream is active and new events will flow. Historical events are not backfilled, only events from this point forward are streamed.
Step 4: Generate events and verify in Grafana Cloud
Trigger a few audited actions so there is something to see. Anything that creates, modifies, or deletes a resource works. For this walkthrough, create an environment, edit it, then delete it. Each of those is a separate audit event.
Now open Explore in Grafana Cloud, select your logs data source, and run:
{service_name="Octopus Deploy"}The events arrive within seconds.
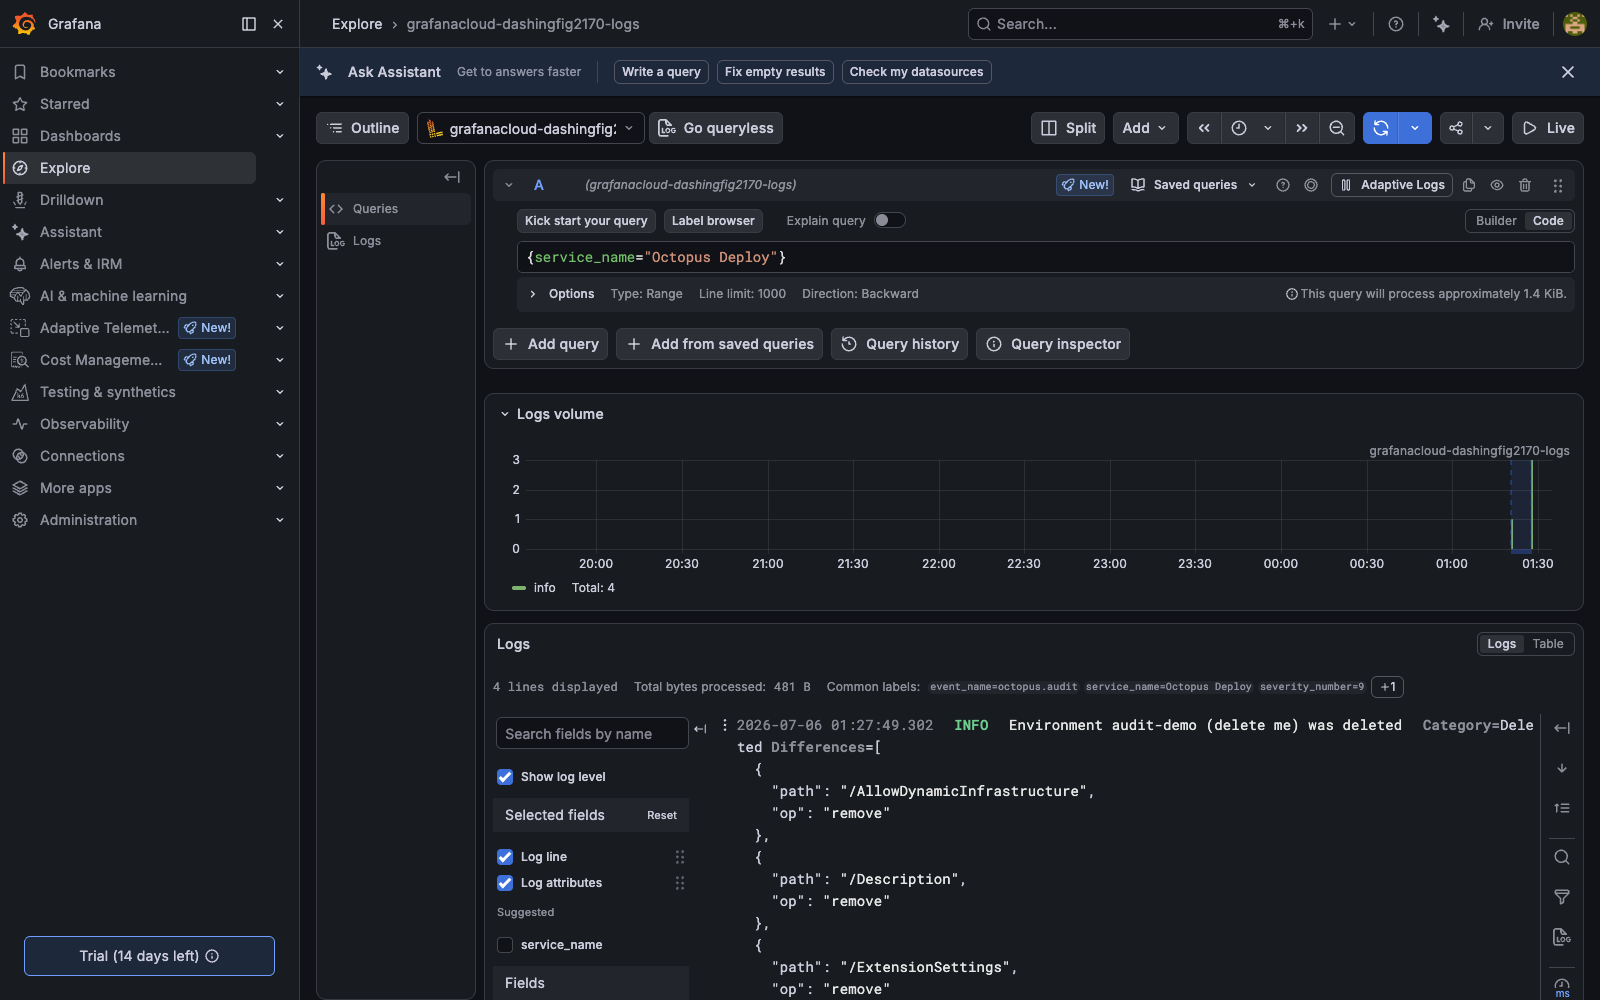
Expand a record and you will see the labels Octopus attaches to every event. These are what make the data useful:
service_name=Octopus Deployevent_name=octopus.auditCategory=Created,Modified, orDeletedUsername= the account that made the changeIpAddress= where the request came fromSpaceIdand the resource ID, such asEnvironmentIdseverity_text=Information
Those labels let you slice the audit trail without parsing message text. If you want every change a specific person made? Filter on Username. And if you want only deletions? Filter on Category:
{service_name="Octopus Deploy"} | Category=`Deleted`That single query is the foundation of the alert you are about to build.
Step 5: Sending Slack alerts
A searchable audit trail is useful but an audit trail that pages you when something sensitive happens is better. Grafana Alerting has a native Slack integration, so no extra service is needed.
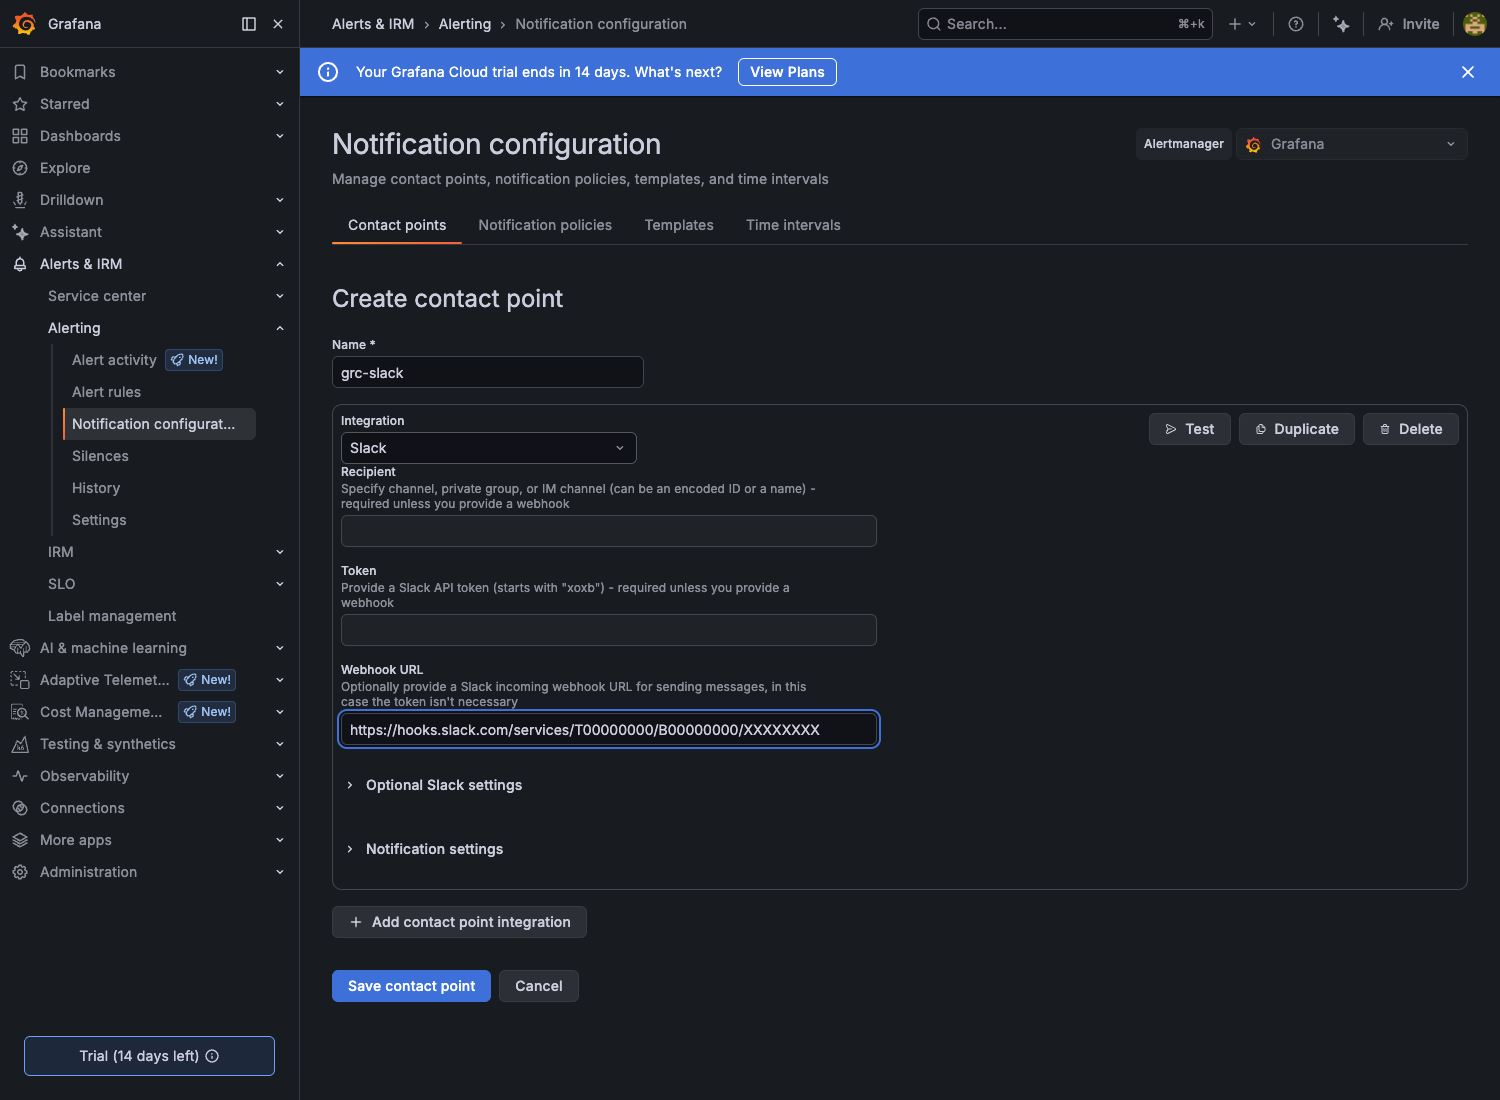
First, create the Slack contact point. In Slack, add an Incoming Webhook for the channel you want, a channel like #grc is a natural home for this.
In Grafana, go to Alerts & IRM > Alerting > Contact points then add a contact point, choose Slack, and paste the webhook URL. Keep that URL secret, anyone who has it can post to your channel.
Next, create the alert rule. Point it at your logs data source and use a query that counts delete events over a short window. Group the count by the labels you want in the alert, so they survive the aggregation and can be used in the message:
sum by (Category, Username, IpAddress, SpaceId, EnvironmentId) (
  count_over_time({service_name="Octopus Deploy"} | Category=`Deleted` [5m])
)
Add a threshold condition of is above 0, so the rule fires whenever a deletion shows up. Give the rule a label like team = grc and route that label to your Slack contact point in the notification policy.
Set the rule’s summary annotation to reference those labels, so the Slack message names the event rather than showing [no value]. Grafana exposes the query’s labels as $labels:
Octopus audit alert: {{ $labels.Category }} event by {{ $labels.Username }} from {{ $labels.IpAddress }}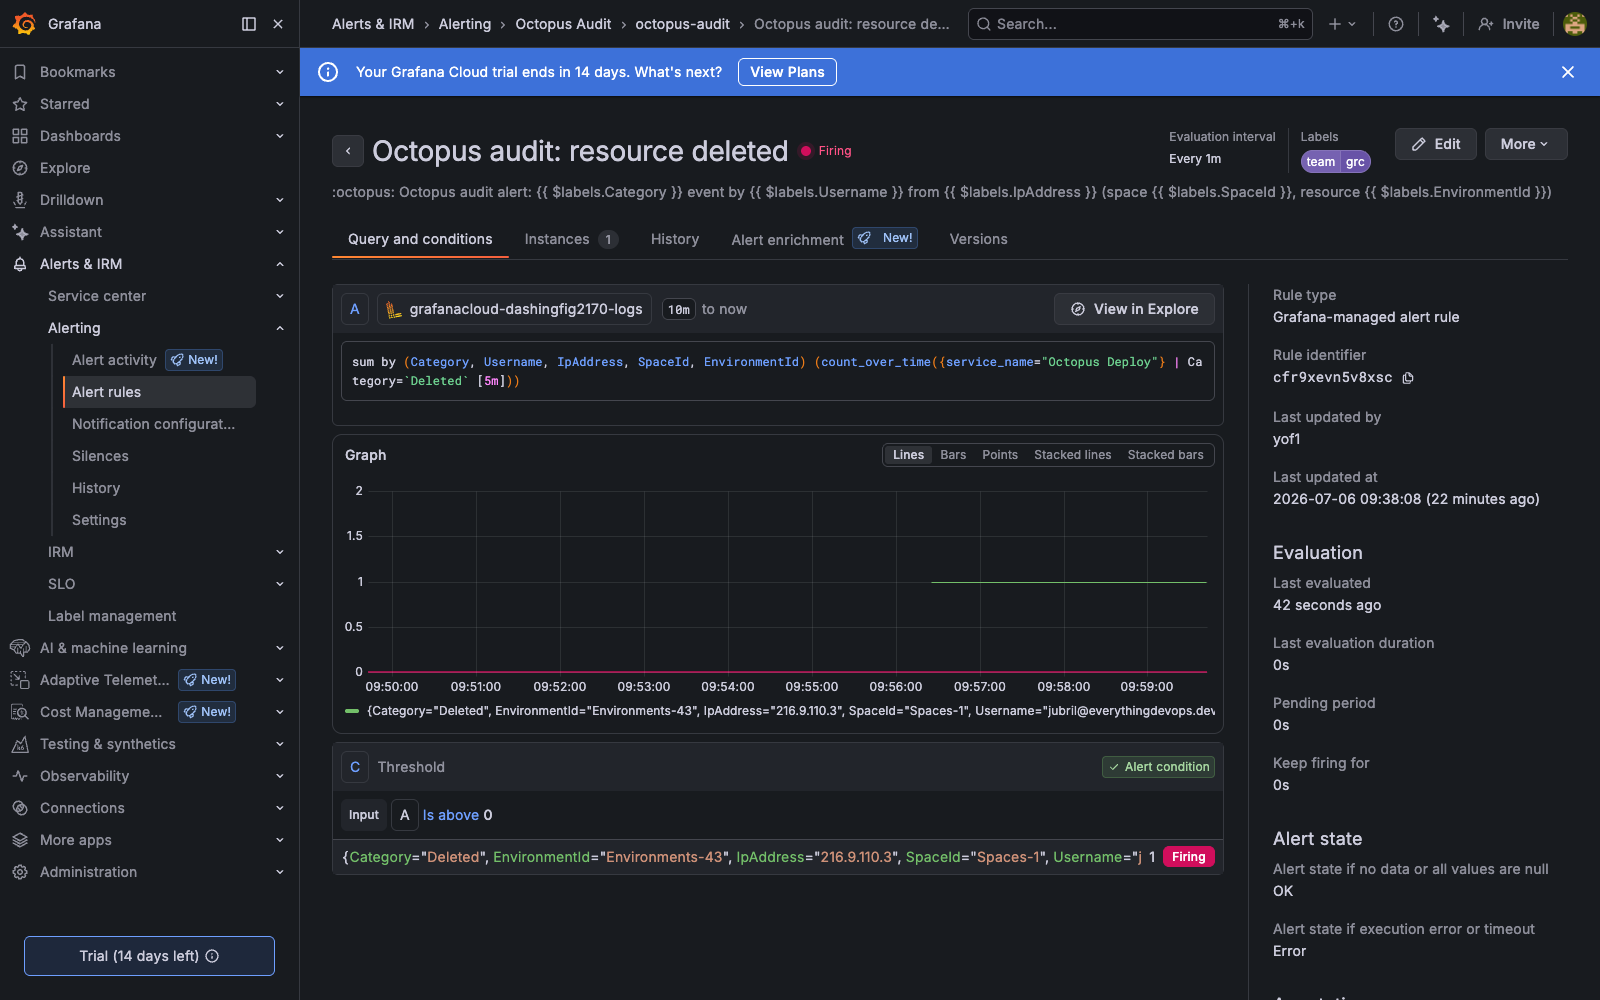
Delete an environment to test it. Within an evaluation cycle the rule moves to Firing, and the instance shows its destination is the Slack contact point.
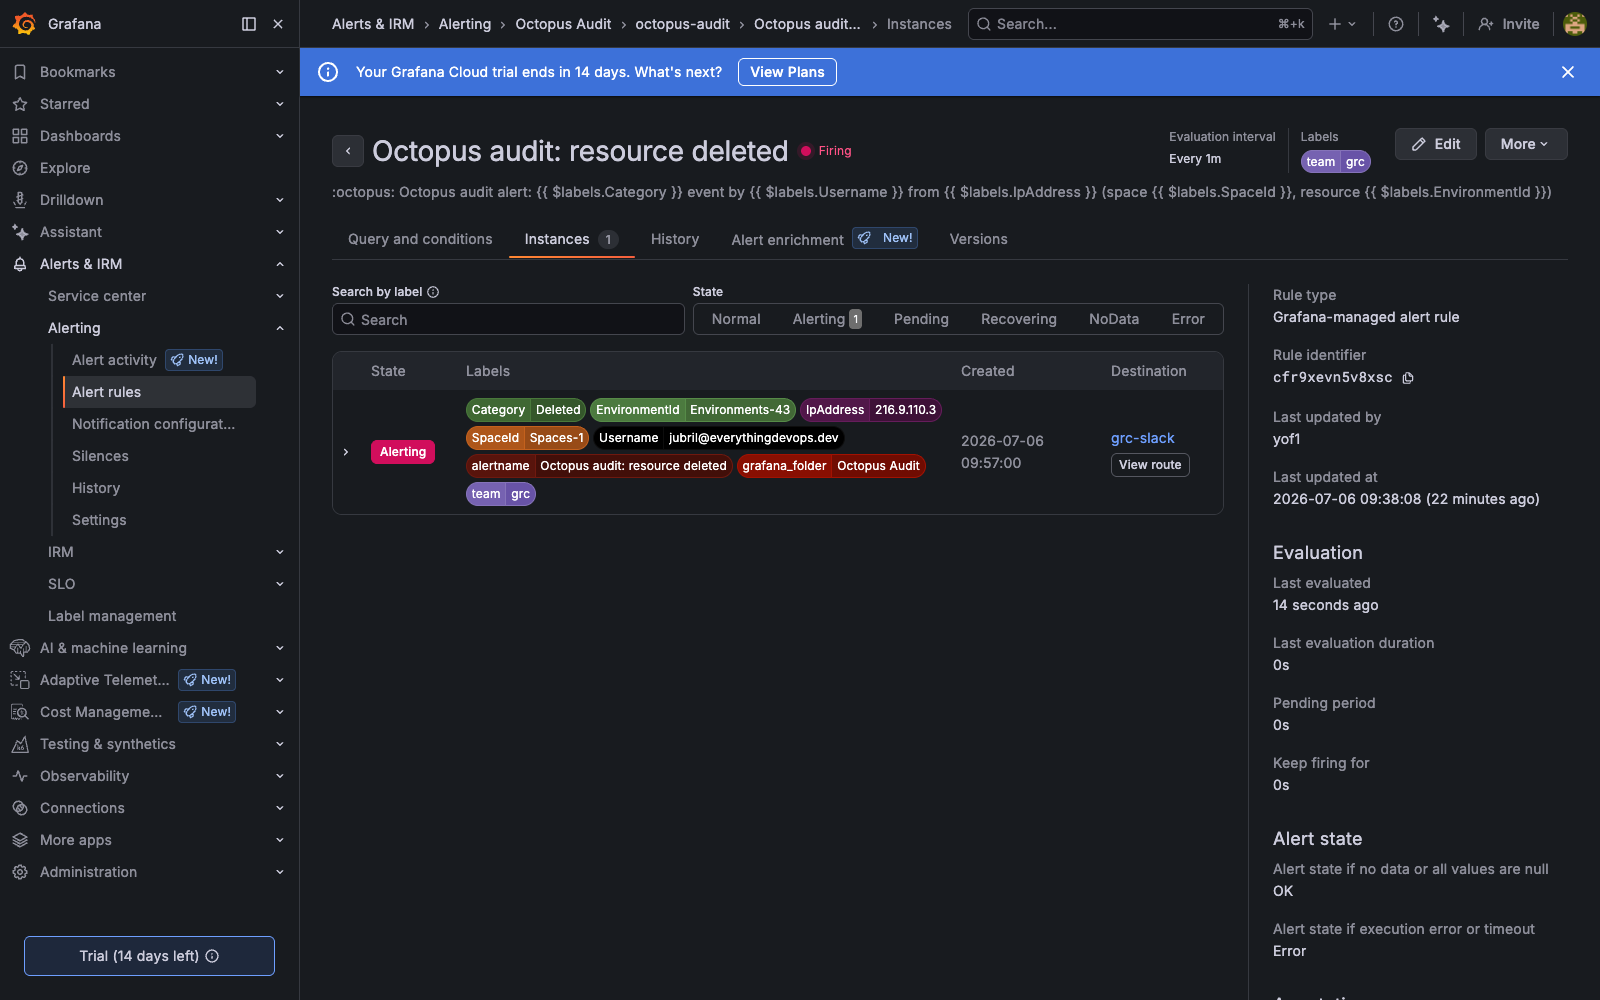
A message lands in your channel naming the event, the user, and the source IP.

Use any backend
The reason to do this over OpenTelemetry rather than a proprietary integration is portability. Nothing in the Octopus configuration is Grafana-specific. Octopus speaks OTLP to a collector, full stop.
To send the same audit stream to Datadog, Honeycomb, Elastic, or a self-hosted backend, you change the collector’s exporter and leave everything else alone. The receiver stays the same, the Octopus Audit Stream config stays the same, additionally you can fan out to two destinations at once by listing two exporters.
That is the whole point of standardizing on OpenTelemetry.
Your audit trail, wherever you watch it
Octopus has been recording who did what since long before you turned this on. The work here was not generating the data, but moving it to where your team looks. Because the transport is OpenTelemetry, that move is a single endpoint away from any SIEM tool you run.
If you want to try it, spin up a free Grafana Cloud account and read the Audit Stream documentation for the exact fields.
If your focus is governance and compliance reporting, look at Compliance Reports.
Happy deployments!
Tags: