
Lately, I caught myself doing the same sequence of actions several times: Prometheus fires an alert (let’s say about a pod being in CrashLoopBackOff),
I search in the deployment/pod logs, realize that the service has run out of memory, then I open Octopus Deploy,
find the right project, then select the environment, bump the resource limit, and finally wait for the rollout to finish and check that the alert has cleared.
The actual fix looks (and it is) pretty straightforward. Most of my time was actually spent context-switching between terminal windows, Kubernetes configs, and Octopus UI tabs. Most routine on-call alerts aren’t complex engineering problems. They often involve repeating the same remediation steps from an existing playbook. We usually know what needs to happen, but we end up viewing and manually copying data between monitoring tools, logs, and deployment systems.
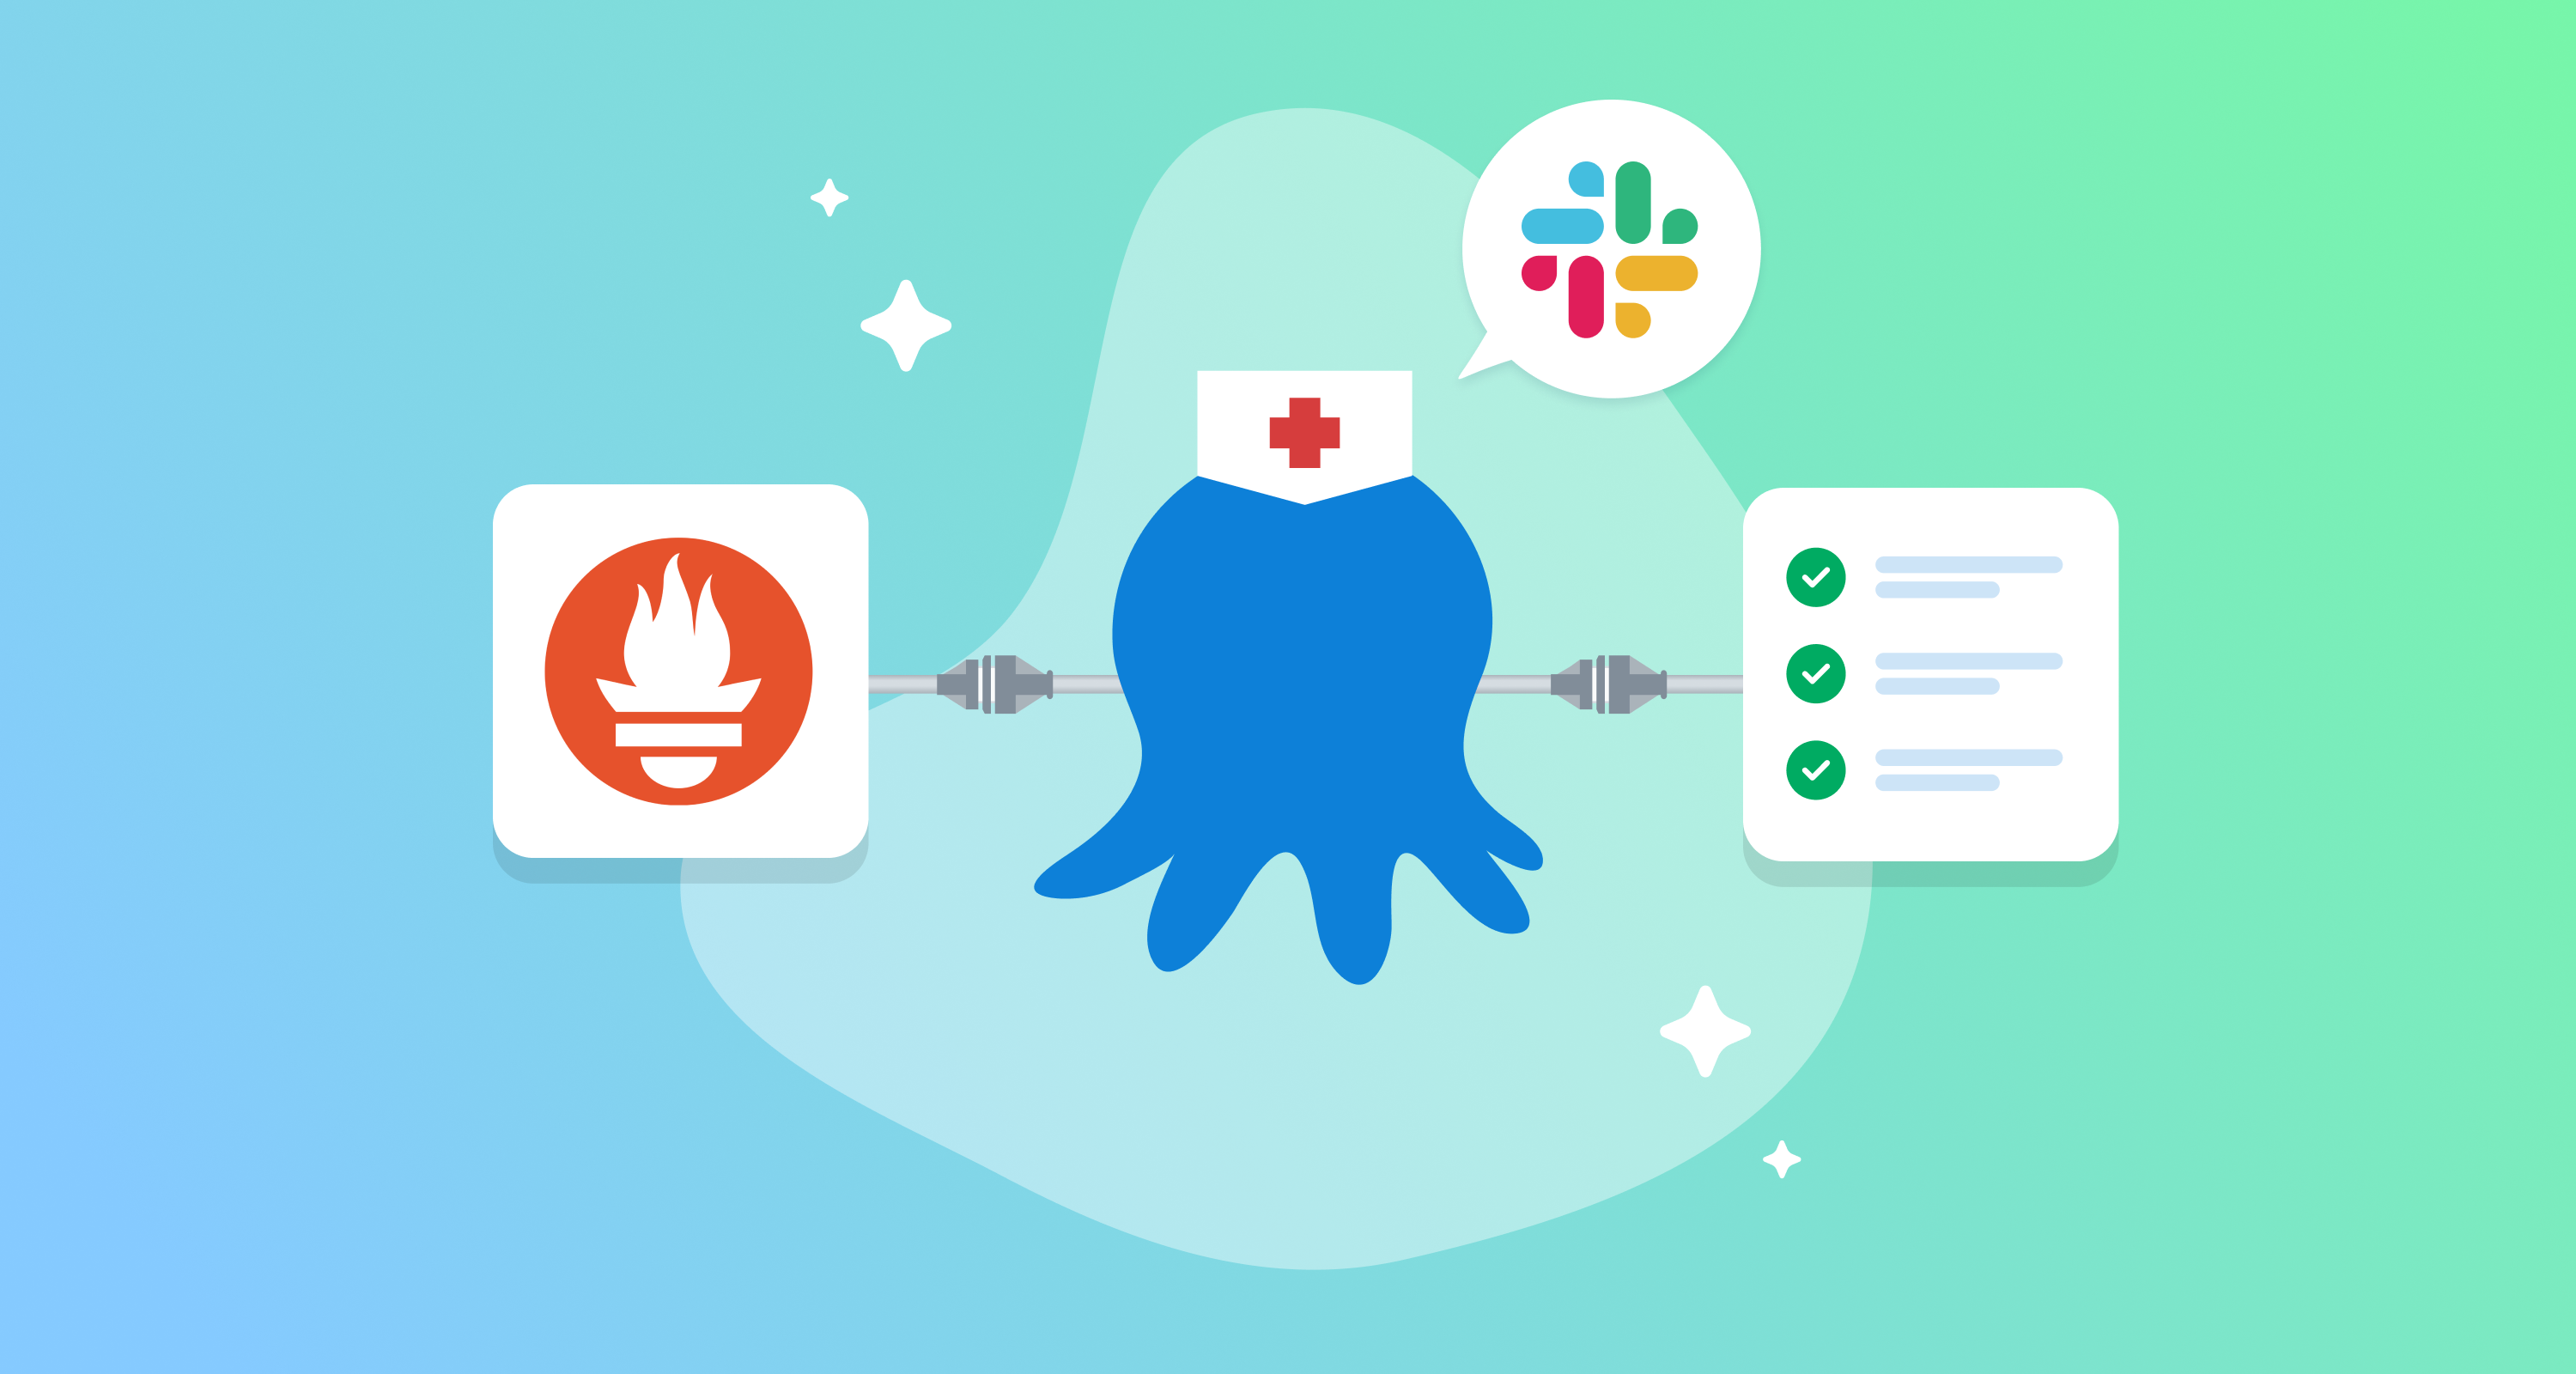
This is what made me build a PoC incident bot, which I call Octopus Healer. It’s a service that listens for Kubernetes alerts, passes the pod context to an AI model to suggest a remediation, and maps the output to a predefined Octopus Deploy runbook. Nothing reaches production until an operator reviews and approves the proposed runbook in Slack.
Why Octopus Deploy is the right execution layer
The first design decision was how to handle execution once my preferred AI model suggests a fix. My initial approach while playing with the AI model was to have it generate kubectl commands—or, even better, execute them without manual intervention.
In a real production environment, though, running raw shell commands directly can quickly make things even worse. It can bypass existing approval flows, use overly broad permissions, and target the wrong environment. Instead of playing with fire, I decided to route all execution through Octopus Deploy.
The bot still handles the initial analysis: receiving the alert, collecting the relevant context, and sending the right prompt to the AI model. Octopus then acts as the execution engine, using the permissions, environments, and approval workflows that are already in place. For teams like ours that follow GitOps principles and keep deployment configuration as code, this approach also provides a clean audit trail. Runbook creation, environment selection, approvals, and execution history all remain traceable alongside the rest of the deployment changes.
The full pipeline
Here’s how everything connects, from Prometheus alert to Slack notification:
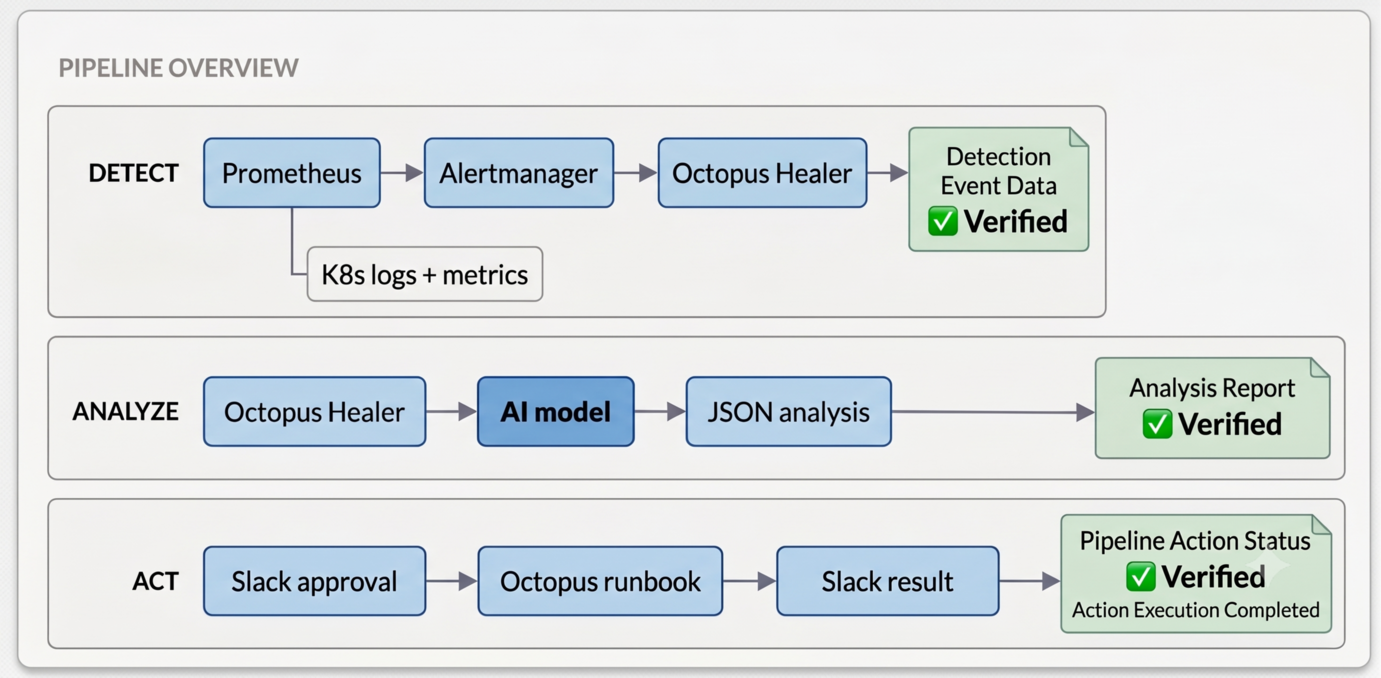
The flow has three phases:
- Prometheus fires an alert; Alertmanager sends a webhook to the bot, which then fetches the affected pod’s logs and any other useful live metrics from the Kubernetes metrics-server (CPU/memory for a
CrashLoopBackOff). - Once the bot has everything it needs, it sends that context to my favorite AI model, which returns a structured JSON analysis with a remediation type, confidence level, blast-radius classification, and the variable values needed to execute the fix.
- The bot posts a Slack notification including the root cause and the available action type. The operator reviews the suggested fix, selects the environment, and approves the creation and execution of the runbook in Octopus Deploy. The bot then posts the result back to Slack.
The whole tool is a single stateless service — no database, no message queue. Approvals live in an in-memory store with a 30-minute TTL. If the operator doesn’t respond within that window, the approval expires, and the on-call engineer handles it manually.
Giving an AI model the right context
I initially sent far too much context to the model. Most of it was unnecessary, so I reduced the payload to the alert metadata, recent logs, resource configuration, and current resource metrics. The goal was to provide enough information for a useful diagnosis without allowing large log payloads to dominate the prompt and increase the cost.
For each analysis, the bot collects a small but sufficient set of data to share with the AI model:
- Basic alert information, including the alert name, namespace, pod, and container.
- For the PoC, I limited the payload to the most recent 4 KB. This worked well for the failure cases I tested and prevented large log payloads from dominating the prompt.
- Depending on the alert and supported remediation type, the bot may collect additional information. For a pod in
CrashLoopBackOff, this includes the configured CPU and memory requests and limits. When available, it also retrieves the pod’s current resource usage through the Kubernetes Metrics API.
The response also needs to be predictable so the service can process it programmatically. The prompt asks the model to return the response in valid JSON only, without an introduction or a Markdown code block, and to use the predefined schema below.
{
  "root_cause": "Clear explanation of the problem",
  "confidence": "HIGH|MEDIUM|LOW",
  "remediation_type": "one of the above types",
  "runbook_params": {
    "namespace": "{{.Namespace}}",
    "deployment": "deployment name",
    "key": "env var name — config_update only",
    "value": "new env var value — config_update only",
    "type": "env or secret — config_update only",
    "container": "container name — image_fix only",
    "registry": "registry URL — image_fix only",
    "image": "image name — image_fix only",
    "tag": "image tag — image_fix only",
    "cpu": "recommended CPU request e.g. 500m — resource_increase only",
    "memory": "recommended memory request e.g. 512Mi — resource_increase only",
    "cpu_limit": "recommended CPU limit e.g. 1000m — resource_increase only",
    "memory_limit": "recommended memory limit e.g. 1Gi — resource_increase only",
    "target_revision": "revision number, 0 for previous — deployment_rollback only"
  },
  "manual_steps": ["any manual verification steps needed"],
  "suggested_blast_radius": "single_pod|single_deployment|multiple_deployments|cluster"
}
The five remediation types the model can choose from and the suggested fix are shown below:
| Type | What it does |
|---|---|
pod_restart | Rolling restart of the affected deployment |
resource_increase | Scale CPU/memory — For the PoC, the bot uses a simple heuristic based on the currently available resource metrics: 1.5× usage for requests and 2× for limits |
config_update | Patch a misconfigured environment variable or config map entry |
image_fix | Roll forward to a corrected image tag |
deployment_rollback | Roll back to the previous revision with a target-revision override |
For the proof of concept, I’ve hardcoded the remediation types and suggested fixes to make the development easier. A production version could support a larger catalog of reviewed remediation templates. The model would still select from an allowlisted set rather than generating arbitrary execution logic.
Turning the model’s analysis into a runbook
After validating the model’s JSON response, the bot maps the selected remediation type to an Octopus runbook template.
The implementation in this proof of concept is limited but clean: each supported remediation type maps to a predefined template whose script bodies use $(variable) placeholders that are filled with values from two sources — the alert itself (namespace, deployment name) and AI’s model runbook_params.
In the example below, the PoC supports only one Octopus runbook step type: kubernetes-script. Future versions could support additional step types provided by Octopus Deploy.
func resourceIncreaseTemplate() *RemediationTemplate {
    return &RemediationTemplate{
        Steps: []RunbookStep{
            {
                Name:     "Update Resource Limits",
                StepType: "kubernetes-script",
                Properties: map[string]string{
                    "scriptBody": "kubectl set resources deployment/$(deployment) -n $(namespace)" +
                        " --requests=cpu=$(cpu),memory=$(memory)" +
                        " --limits=cpu=$(cpu_limit),memory=$(memory_limit)",
                },
            },
            {
                Name:     "Trigger Rollout",
                StepType: "kubernetes-script",
                Properties: map[string]string{
                    "scriptBody": "kubectl rollout restart deployment/$(deployment) -n $(namespace)",
                },
            },
            {
                Name:     "Wait for Rollout",
                StepType: "kubernetes-script",
                Properties: map[string]string{
                    "scriptBody": "kubectl rollout status deployment/$(deployment) -n $(namespace) --timeout=5m",
                },
            },
        },
    }
}
The $(deployment) and $(namespace) placeholders come from the alert. The resource values — $(cpu), $(memory), $(cpu_limit), $(memory_limit) — come straight from the AI model’s response runbook_params.
The runbook generator then merges both sources and applies the model’s values to the runbook template, returning a ready-to-use runbook.
The last part is to talk to the Octopus API to create the live runbook, publish a snapshot and finally execute it in the environment selected by the operator.
Each runbook gets a unique, generated name that includes the remediation type, the incident resource, and a timestamp suffix (resource_increase-api-pod-1722687423), so every incident is traceable by type, workload, and time.
A couple of integration details that are worth highlighting are:
- Octopus Deploy supports two types of projects, standard and git-backed. This introduces some minor differences at the API level, but the bot handles both project types transparently.
- The alert coming from Prometheus and the Octopus Deploy app know nothing about each other, so we need to create a link between the Kubernetes workload and its Octopus project. This can be easily done by adding an annotation on the Deployment as shown below:
metadata:
  annotations:
    octopus.com/project-id: Projects-42
If the annotation is absent, the bot asks the operator to pick a project in Slack rather than failing silently.
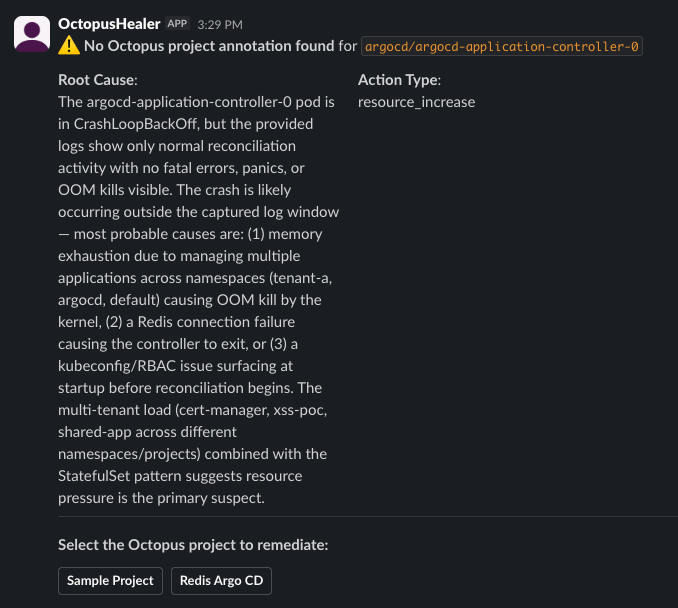
In production, I would either require the annotation or restrict the Slack picker to an allowlisted set of projects. These defensive fallbacks in the flow can be really helpful sometimes, but I wouldn’t rely on them for large-scale systems.
Fully automated or operator-driven?
While building the bot, I kept wondering how far I could take the automation. For local testing, I added an AUTO_APPROVE=true option that skips the Slack interaction and executes the generated runbook directly.
I would not enable that option in production based only on the confidence value returned by the AI model. A model reporting HIGH confidence does not guarantee that its diagnosis is correct or that the proposed action is safe.
For now, the production-oriented workflow keeps the operator involved at three points:
- The operator selects the target Octopus environment.
- The bot generates the runbook and posts a preview of its steps in Slack.
- The operator reviews the proposed actions and either approves or rejects the execution.
Choosing the environment is a separate step because the bot cannot always determine the intended target from the Prometheus alert alone. After the environment is selected, the operator sees the actual runbook steps before anything is executed. This makes the approval more meaningful than simply asking someone to approve a short AI-generated description.
The blast radius is also shown in the approval flow. Instead of relying only on the model to classify it, the bot can derive most of the scope from the selected remediation template and its target. Restarting a single deployment, for example, is clearly different from applying a change across multiple workloads or at the cluster level.
A future version could allow some remediations to run automatically, but only when they pass a deterministic policy. That policy could require:
- an allowlisted remediation type;
- a valid annotation linking the workload to a known Octopus project;
- an environment that can be derived without operator input;
- a limited blast radius;
- validated parameters within predefined bounds;
- and a successful dry run or policy check.
The model’s confidence could still be included as an additional signal, but it should not be the control that authorizes execution.
There is another limitation to the current analysis. The model sees the alert, the pod configuration, recent logs, and current resource metrics, but it does not know everything that happened before the incident.
For example, a pod may start crashing immediately after a configuration change. Based only on the current symptoms, increasing its memory limit might appear reasonable. In reality, the correct action could be to roll back the most recent deployment. The suggestion may appear valid in the context provided to the model, yet be wrong because the important historical context is missing.
This is one of the areas I want to improve next. Adding recent Octopus deployments, configuration changes, image updates, and previous revisions to the diagnostic context would help the model distinguish between a resource problem and an incident caused by a recent change.
Until that context and the deterministic safety checks are in place, keeping an operator in the loop is not just an approval mechanism. It is part of the incident diagnosis.
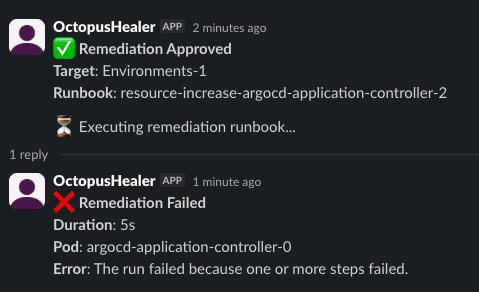
After execution begins, the bot continues posting status updates in Slack until the runbook succeeds or fails
What I learned — and what’s next
Wiring an LLM into an automated deployment pipeline highlighted a few messy edge cases early on:
In the first version, I let the model generate the full kubectl command. That proved unreliable because in some cases, it returned kubectl flags that did not exist.
In other cases, it added Markdown or explanatory text even though the prompt requested only the command.
So I decided to change the design so the model no longer generates executable commands. It now selects one of the supported remediation types and provides only the required parameter values in a predefined JSON format. The bot validates that response and uses those values to fill an existing runbook template. This keeps the model involved in the diagnosis without allowing it to decide exactly which command will run.
Config as Code required more special handling than I expected. Config as Code required more special handling than I expected. Supporting Git-backed projects meant maintaining separate code paths for many API operations. Compound runbook process IDs and Git-reference URL encoding were particularly tedious to debug. The additional complexity is worthwhile for the Git audit trail, but it increased the integration surface considerably.
The in-memory approval store is suitable only for the current PoC. Active approvals currently live in a Go map with a 30-minute TTL. This avoids adding an external dependency in a single-instance deployment, but restarting the pod during an incident removes all pending approvals. This is intentional technical debt for now. A production, highly available version would need shared storage such as Redis or PostgreSQL.
What’s next
My immediate priority is finishing HMAC signature validation for incoming Slack webhooks. The signing secret is already parsed, but the request validation itself is not yet implemented, so the current PoC should not be exposed as a production Slack endpoint. After that, I plan to create a Helm chart, add support for more alert types, and include recent deployment history in the diagnostic context. The main lesson from the PoC is that the model should help interpret the incident, not control execution. Keeping the remediation logic in reviewed Octopus runbooks makes the system easier to audit, validate, and operate safely.