
When you sync an application in Argo CD, you see straight away whether it’s healthy, which resources changed, and which revision is running. What you don’t know is if this sync increased the cost and how.
That part shows up later on the cloud bill, and by then it’s hard to figure out which change was responsible. Today we’re releasing Cost Intelligence for Argo CD, an open source extension that shows the cost of each application in a tab in the Argo CD UI, next to everything else you already look at.
The cloud bill doesn’t know about your syncs
Let’s take a typical case. A team releases a new version, adds a few replicas, or asks for bigger CPU and memory requests. Argo CD syncs the change, but it’s hard to figure out how it affects the overall cost.
Cloud bills can split a cluster’s cost by namespace or pod label, with split cost allocation for EKS or cost allocation on GKE, if someone has turned it on. They still don’t know about Argo CD applications or syncs. Argo CD 3 tracks the resources of an application with an annotation by default, not a label, so the bill reports usually have no label to split the cost by application, unless your teams add one to their pods themselves. So when the cost goes up, the team has to work out which change caused it, or someone on the platform team does that for them by hand.
Now imagine a more complicated example where you have shared namespaces. If several applications deploy to the same namespace, a cost per namespace doesn’t reveal which of them have actually increased the costs.
How it works
Cost Intelligence for Argo CD runs next to Argo CD and gets its numbers from OpenCost. After every successful sync, Argo CD Notifications calls the plugin, which asks OpenCost what the application cost over the previous 24 hours and stores the result as a measurement. The plugin projects each measurement onto a 30-day month from the hours OpenCost has data for, so an application that has only run for a few hours still gets a monthly figure.
Because each measurement looks back 24 hours, the one taken right after a sync still mostly reflects the version before it, and you see the full cost of a change about a day after you sync it.
The figures cover only the pods of the workloads Argo CD manages for that application. CronJob Jobs or ReplicaSets count under their parent, and the plugin leaves out other workloads in the same namespace, so applications that share a namespace show only their costs.
When the plugin starts, it measures every application that doesn’t have a cost yet, so most tabs show one within a few minutes, and you don’t have to sync them to see the numbers. A new application shows its cost a few minutes after its first sync, once its namespace exists and OpenCost has some data for it. The plugin also stores each application’s cost per day, so the history is still there after OpenCost’s own Prometheus no longer has those days.
What a team sees on its application
Open an application in Argo CD and you’ll find a Cost Intelligence tab with three views: Actual costs, Resources, and Trends.
Actual costs
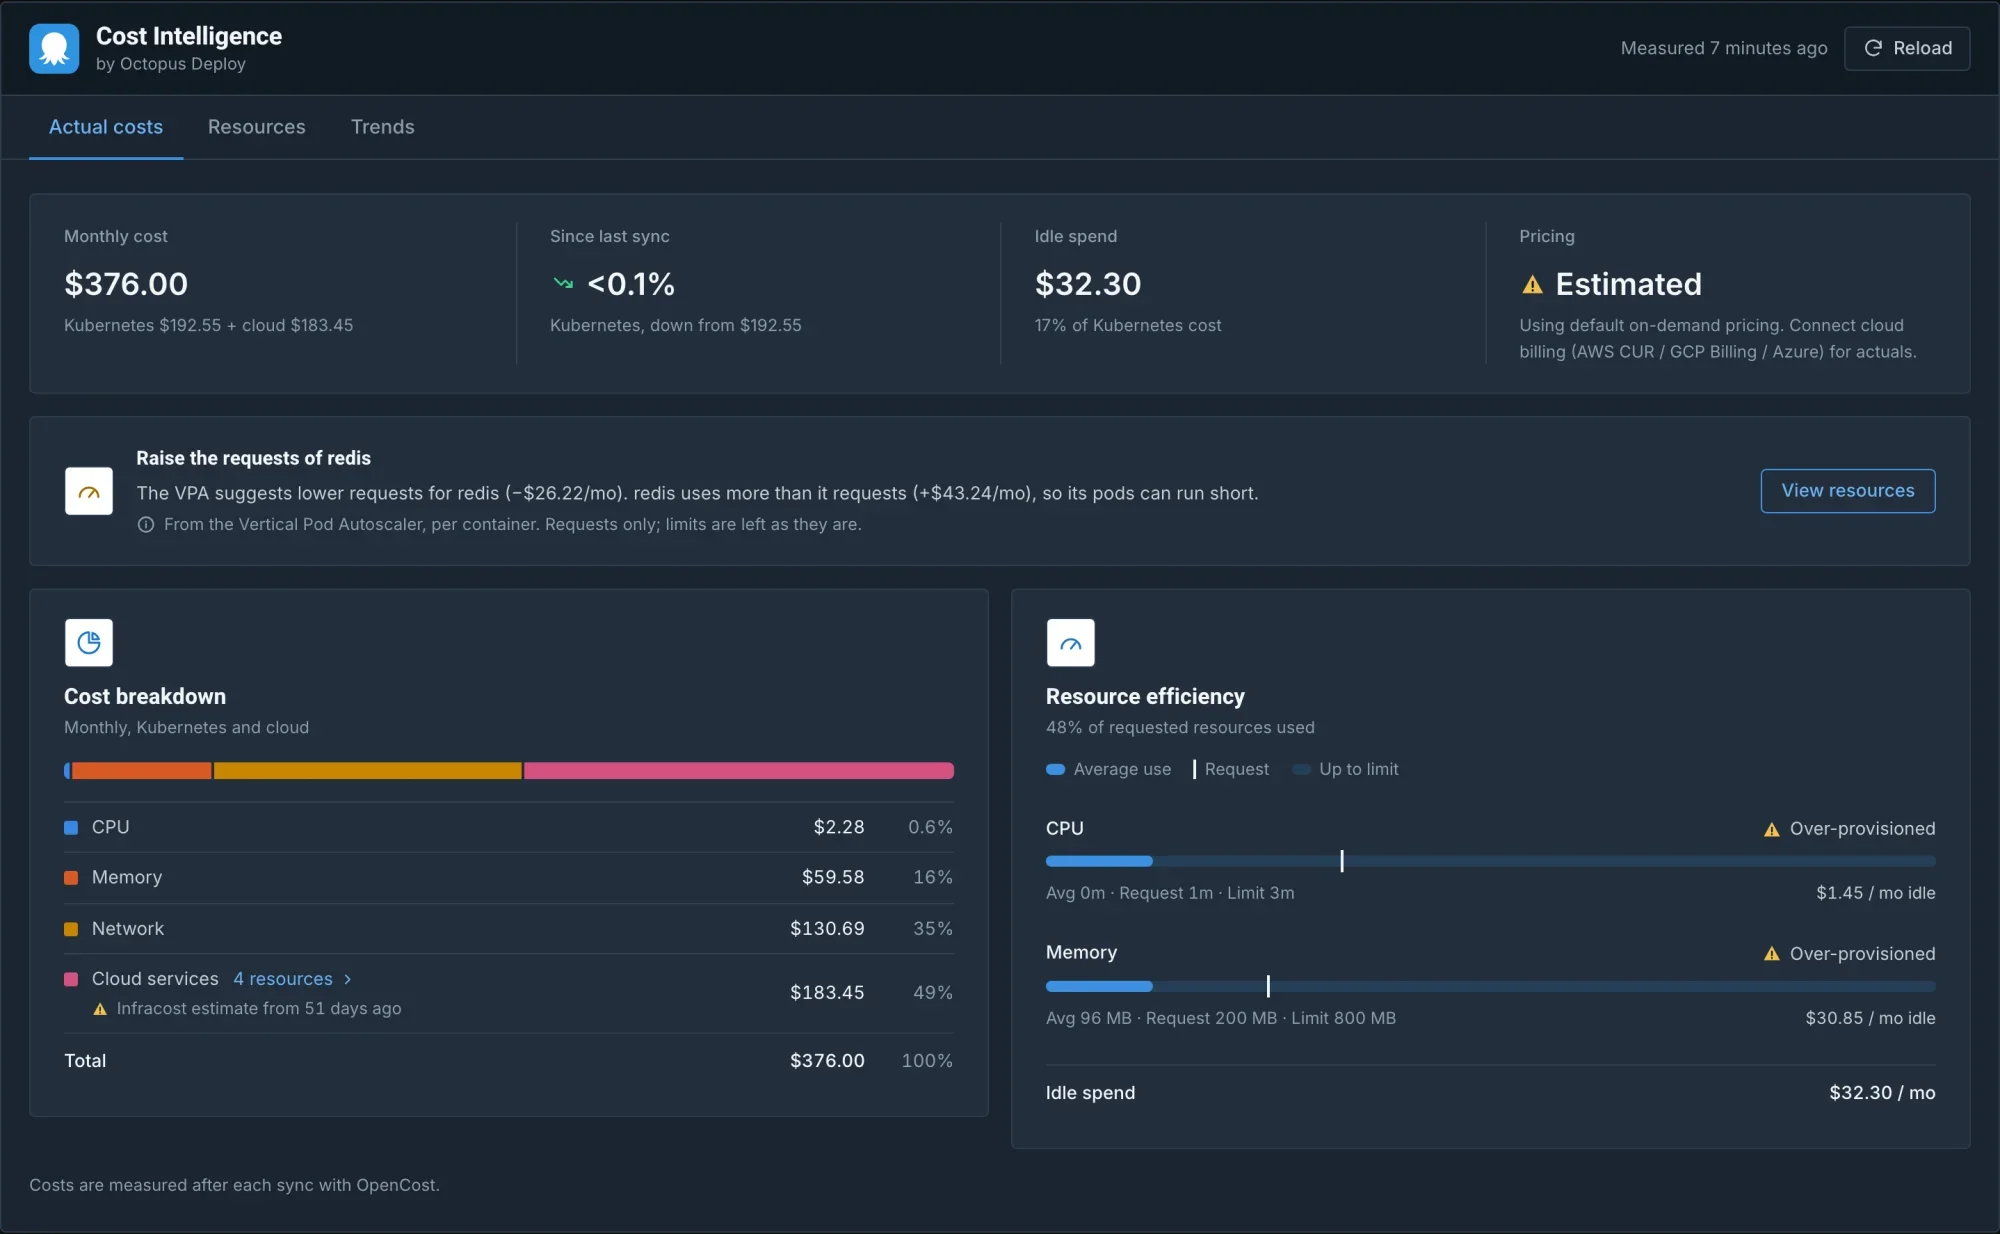
Actual costs is where most teams will start. The top row shows the projected Monthly cost of the application and how much its Kubernetes cost changed Since last sync. OpenCost can’t see the cloud services an application uses outside the cluster, like a database or a bucket. If your CI runs Infracost, it can push those estimates to the plugin, and the monthly cost includes them.
Next to those, Idle spend is what the application pays for CPU and memory it requests but doesn’t use, and Pricing shows whether OpenCost priced the resources with your cloud provider’s prices or with public list prices. Below them, the breakdown splits the cost into CPU, memory, storage, network, cloud services, load balancers, and GPU, and lists only the ones that cost something. Under it, the tab shows shared costs and the carbon footprint, outside the total.
The tab shows when the measurement was taken. It shows Projected from N hours of data when OpenCost has less than a day of data for the application, and it marks a measurement as Stale once it’s a week old.
When the cost changed since the previous sync, the What changed panel lists the workloads whose cost went up or down, each with its monthly cost before and after. If the pods use less than half of the CPU they request over a full day, the tab suggests a smaller request and shows how the smaller request changes the cost. If you run the Vertical Pod Autoscaler, which I cover under Resources below, the tab shows the autoscaler’s suggestions here instead, and those cover memory as well as CPU. And when the Kubernetes cost rises well above the earlier measurements, the tab shows a Cost warning, or a Cost alert for a bigger rise.
Resources
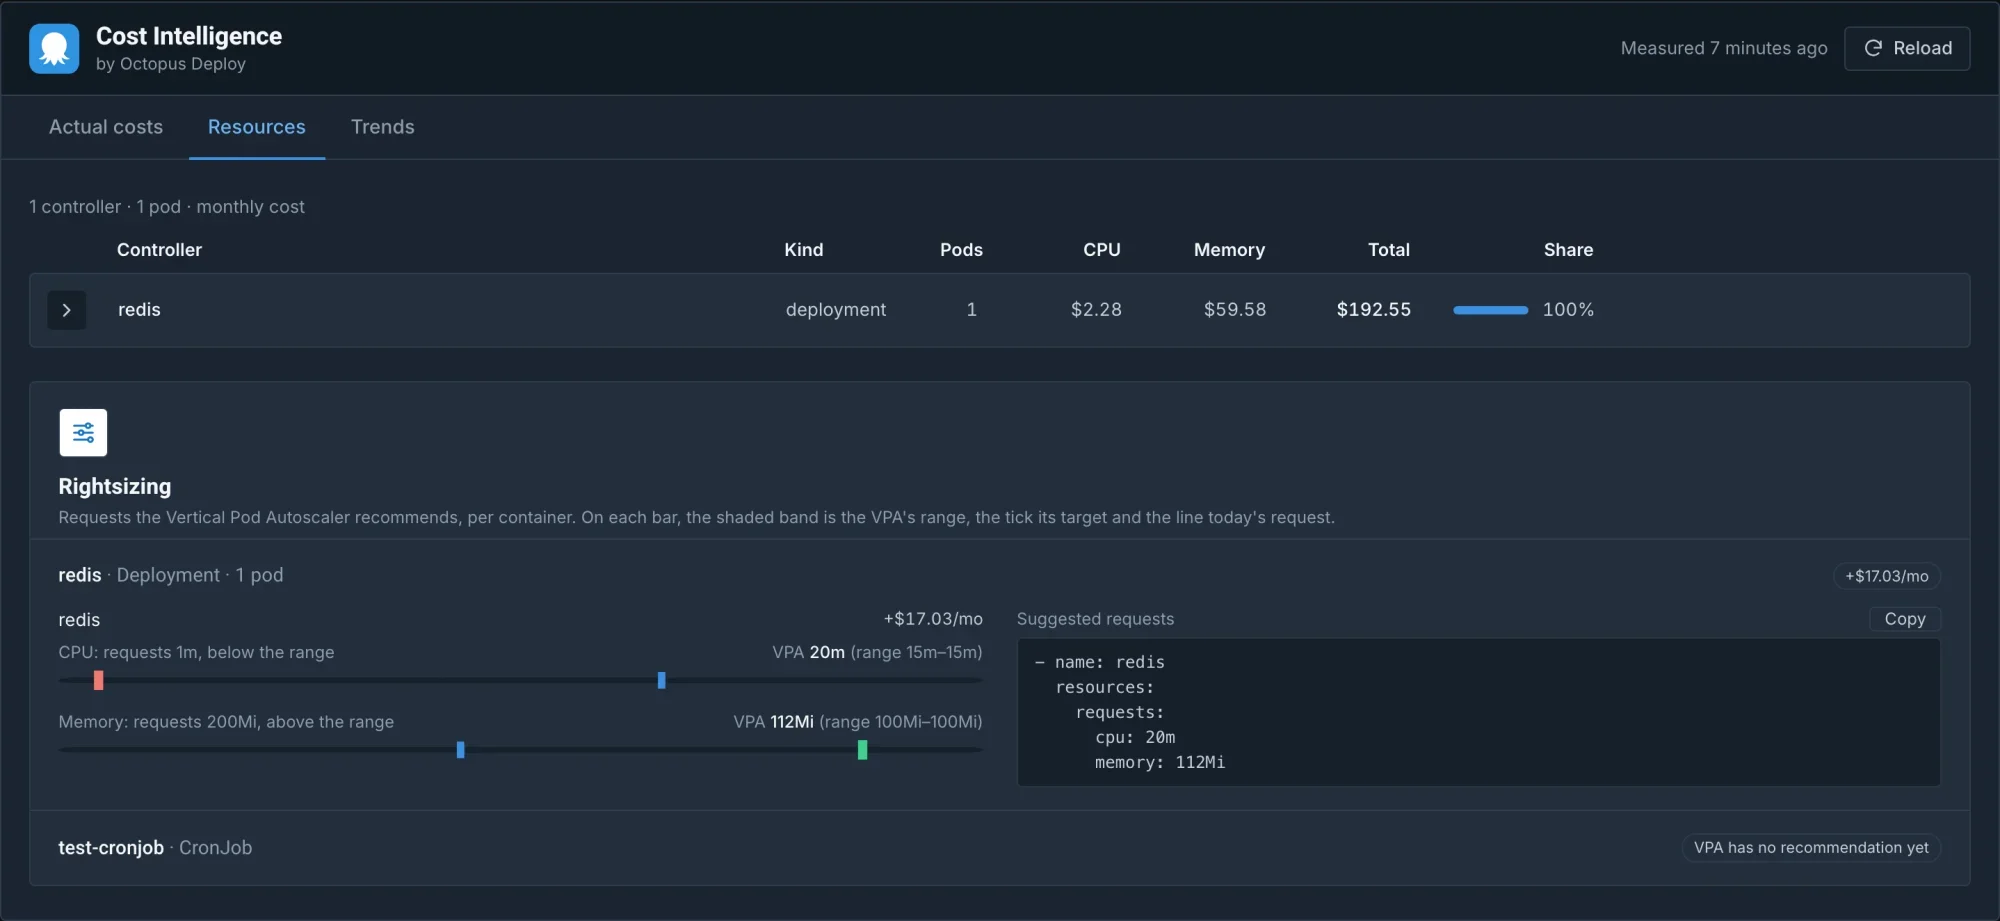
Resources shows the monthly cost of each workload, with its CPU, memory, and share of the total, and each workload expands to its pods.
If you run the Vertical Pod Autoscaler in Off mode, or let Goldilocks create those autoscalers for you, this view also suggests CPU and memory requests per container, priced with OpenCost’s figures.
The suggestions start once the autoscaler has about a day of history, and they cover requests only, never limits.
A copy button gives you the suggested requests as YAML to paste into the pod template.
When there are pods that report no CPU or memory use, like evicted pods, pods stuck in Pending, or finished Jobs that still hold volumes or load balancers, the view lists them separately as orphaned pods.
Trends
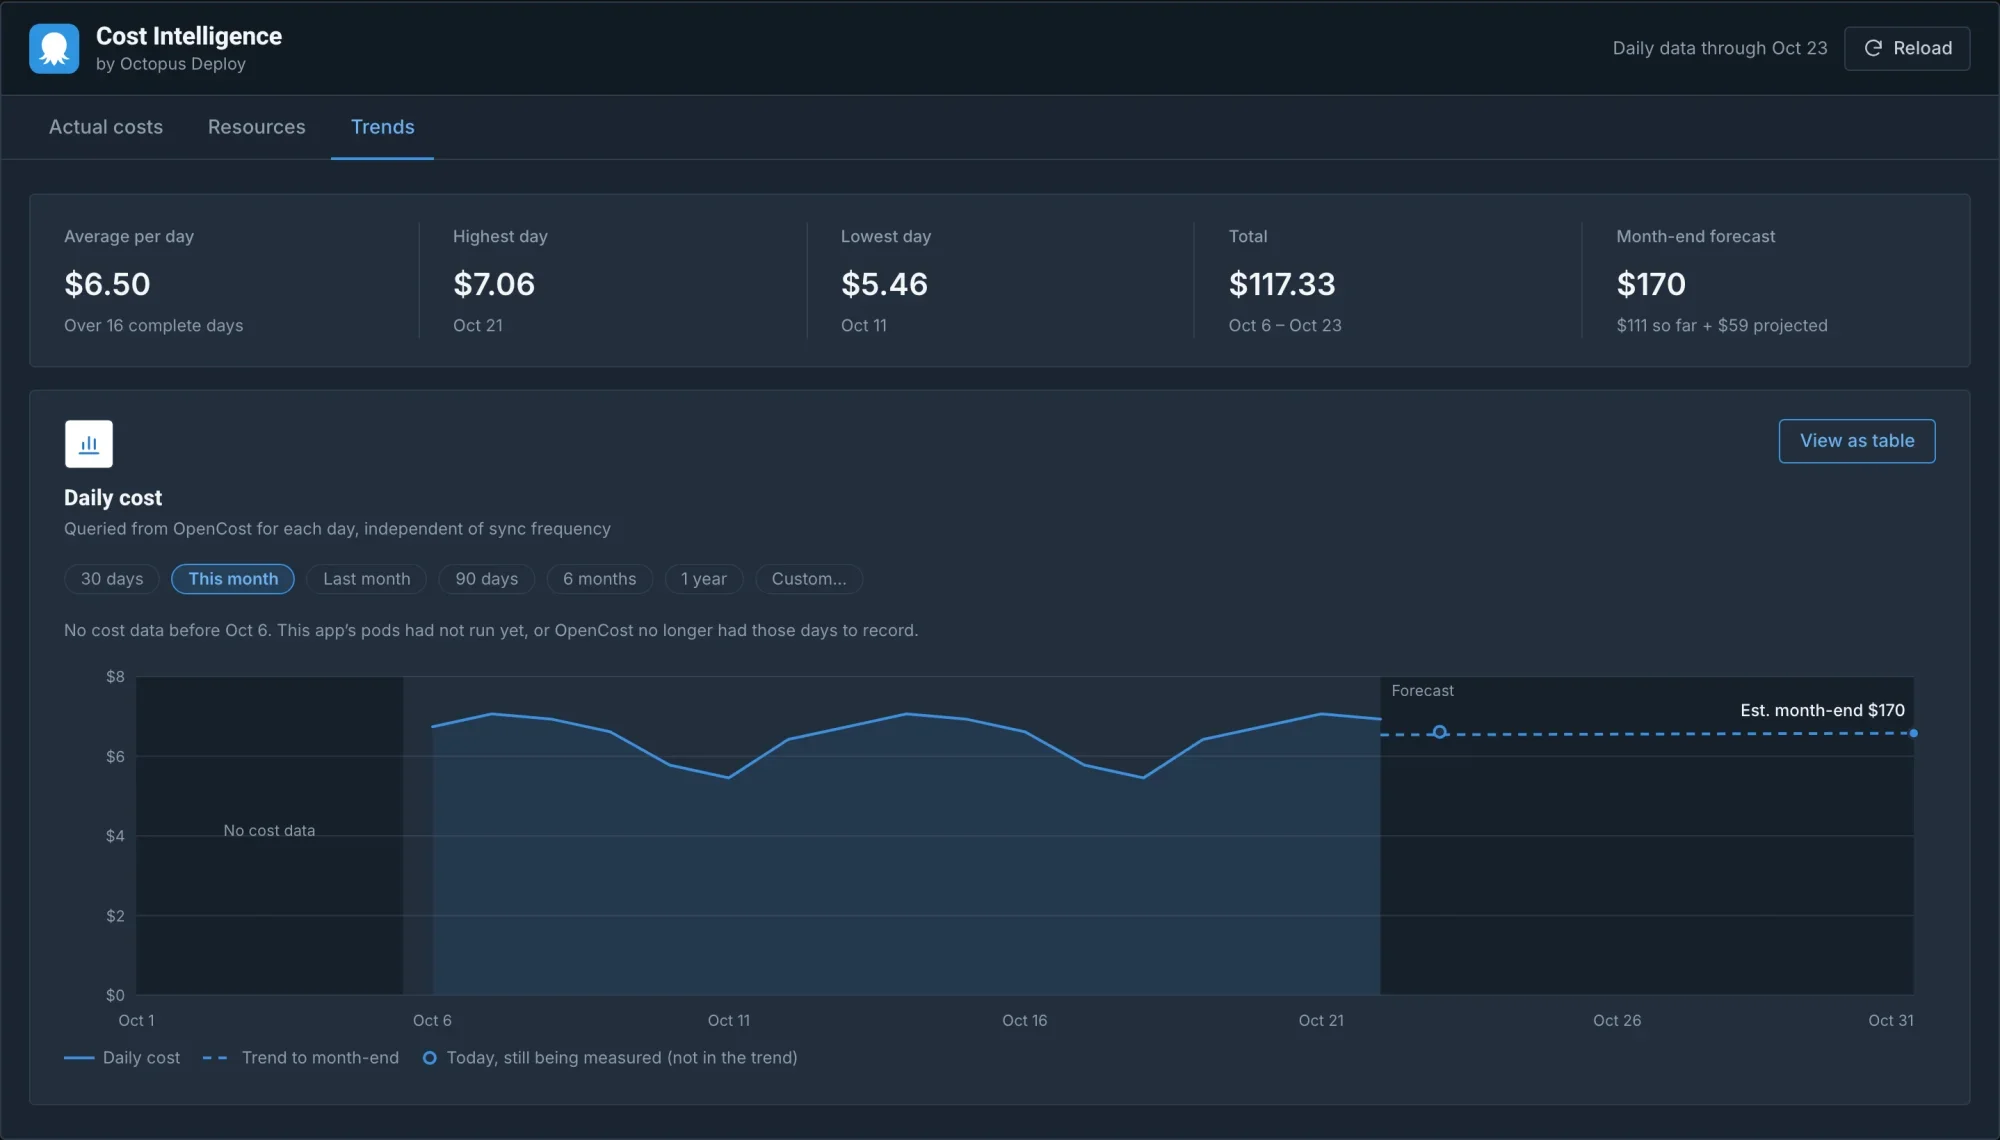
Trends shows the daily cost of the application for ranges from 30 days to a year, this month, last month, or a custom range, and longer ranges show weeks or months instead of days. You can see the same numbers as a table with View as table. The history goes back 400 days by default, since the plugin keeps each day itself. When the range includes today, there’s also a month-end forecast, which is what the month has cost so far plus a straight-line trend of the last 30 days, once there are seven complete days of data.
An example: one more replica
Here’s how this looks for a team. On Monday they release a version that adds a second replica to their checkout Deployment.
The measurement taken right after that sync covers the 24 hours before it, so it still mostly reflects the old version with one replica.
On Tuesday they release something else. The measurement after that sync covers the day Monday’s version ran, so the What changed panel lists checkout with its monthly cost before and after, and if Tuesday’s release changed the cost too, they’ll see it at the next sync.
The team knows which workload increased the cost without digging through bill reports.
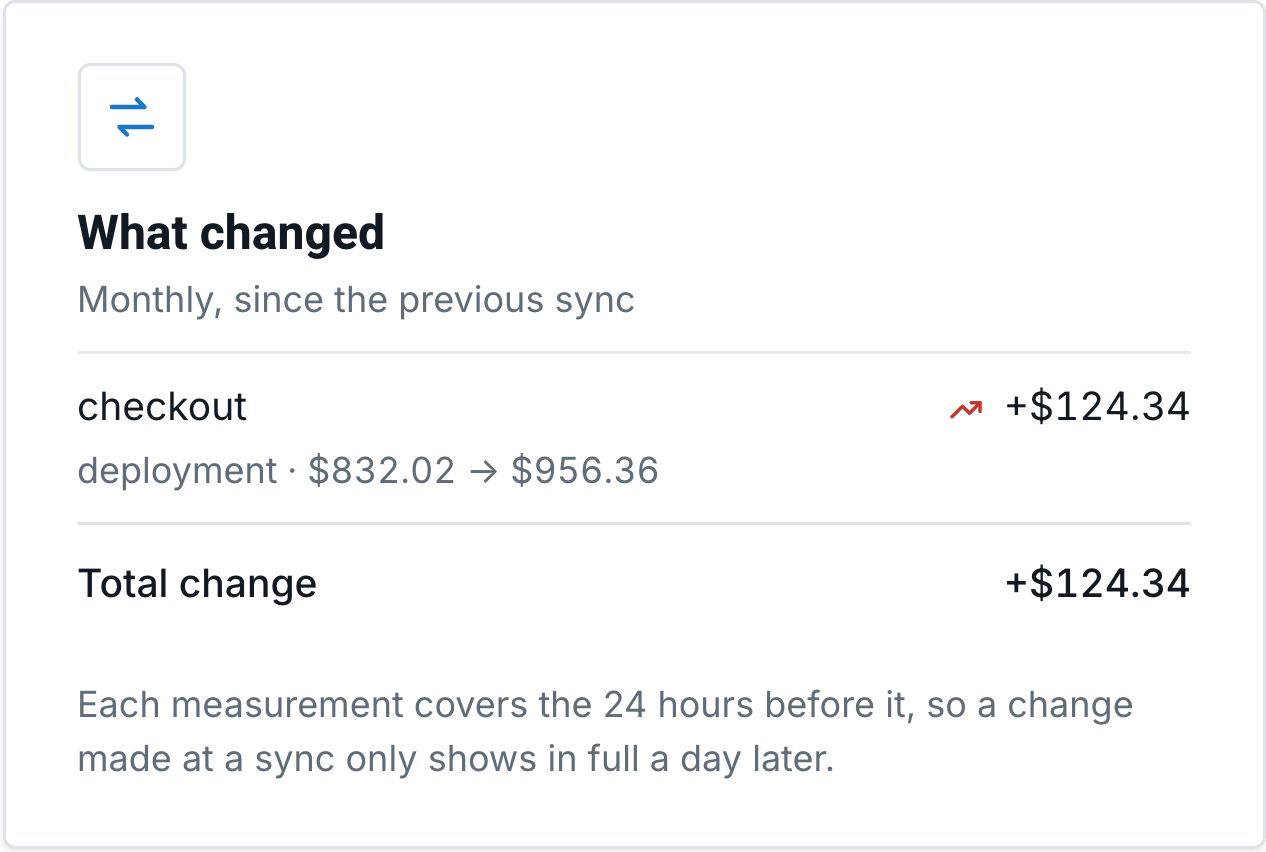
The What changed panel only updates when the application syncs, but the Trends view records the cost every day, so even without a second sync the team sees the daily cost go up from the first full day with two replicas.
For the platform team
Application teams are the people we built the tab for, but the people who run the cluster get a page of their own in Argo CD’s sidebar. It shows the cost per namespace, the applications ranked by idle spend, chargeback by any Kubernetes label, and the control-plane fee.
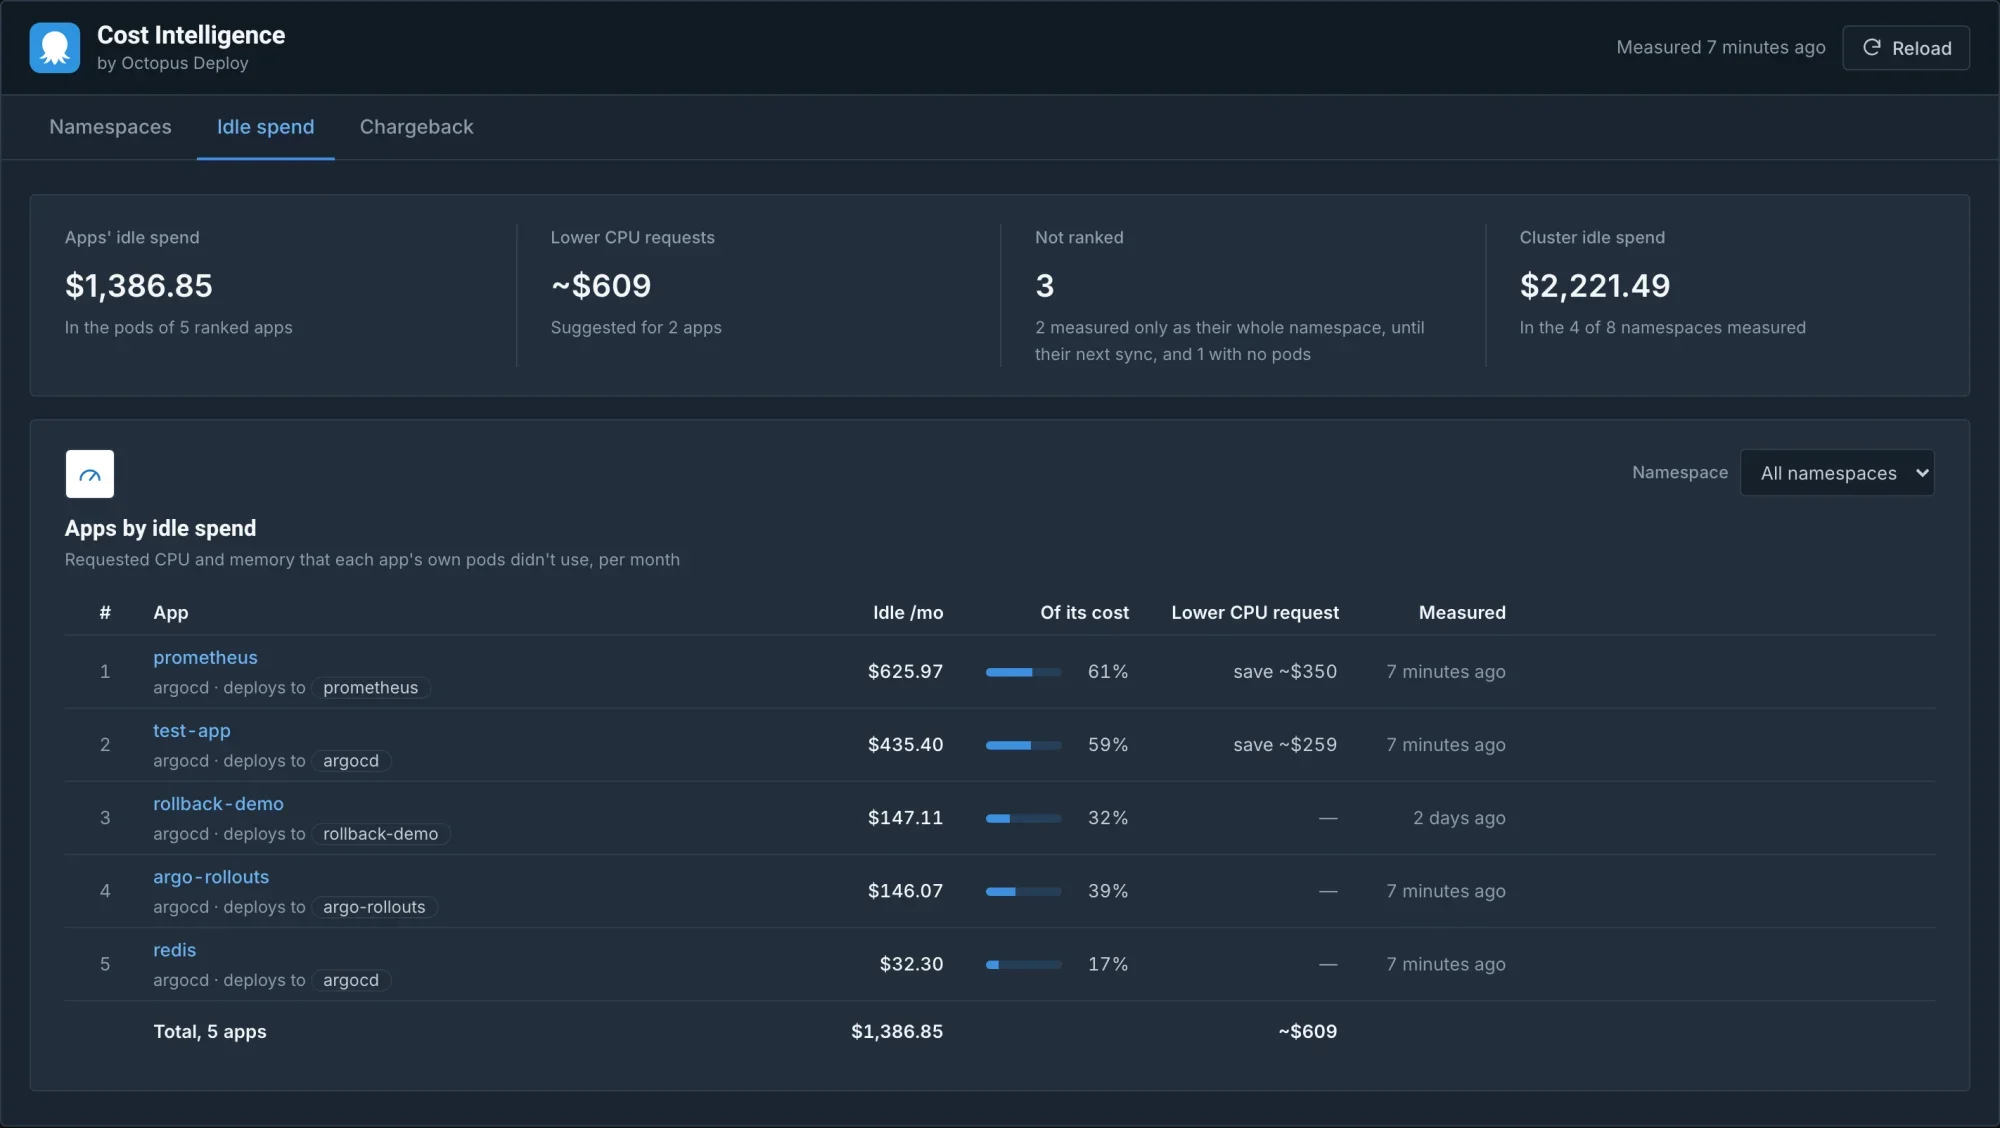
Since that page shows what every team spends, your Argo CD RBAC configuration controls who can see it.
With the Helm install below, the chart creates an Application that deploys nothing, and anyone who can view that Application sees the page.
That includes role:readonly if it’s your default policy, so check who has access after you install. The installation guide shows how to let a team in.
A separate exporter, on by default, publishes each application’s cost per hour as Prometheus metrics, labeled so they join with argocd_app_info.
If you run the Prometheus Operator, the chart can also add a ServiceMonitor, and a PrometheusRule with a recording rule and some starter alerts.
What it doesn’t do yet
A few limits, so you know what to expect before you install it:
- It measures only the cluster OpenCost runs in, and that has to be the cluster Argo CD runs in. If Argo CD deploys an application to another cluster, its tab shows Deploys to another cluster and shows no costs.
- The numbers are only as good as OpenCost’s. Without your cloud provider’s prices, OpenCost uses public list prices, and the tab shows that under Pricing.
- It’s an early release. Helm values and the database schema may still change between minor versions, and the changelog lists any breaking change.
Try it on your own cluster
You need Argo CD 3.4, 3.5, or 3.6, OpenCost 1.121.1 or newer on the same cluster, and Helm 3.8 or newer. Then it’s one Helm chart:
helm install argocd-cost-intelligence \
  oci://ghcr.io/octopusdeploy/charts/argocd-cost-intelligence \
  --version 0.1.0 \
  --namespace argocd-cost-intel --create-namespace \
  --set namespace.create=false \
  --set postgres.auth.password=<your-secure-password> \
  --wait --timeout 10m
The chart installs the plugin and a PostgreSQL database, and adds the tab and the sync notification to Argo CD for you.
If you manage Argo CD itself from Git, the next sync would undo those changes, so install with --set features.autoPatchArgoCd=false and add them to Git instead, as the GitOps install guide describes.
At first only the built-in admin role sees the tab, so add an RBAC rule for any other role that needs it.
No OpenCost yet? The repository has a mock OpenCost that prices the pods in each namespace with made-up but stable prices, so you can look at the tab before you install the real thing.
The docs are at argocd-cost-intelligence.readthedocs.io and the code is at github.com/OctopusDeploy/argocd-cost-intelligence, open source under the Apache 2.0 license. It’s a community project, and it isn’t affiliated with or endorsed by the Argo project, the CNCF, or OpenCost.
I’d like to hear what you’d want it to do next, so open an issue or send a pull request.
Tags: