
The 2023 Accelerate State of DevOps Report has arrived, and we’re excited to be sponsors again this year. This long-running research effort has shown how software delivery performance positively impacts organizational performance. Using the insights into concrete practices that drive performance, you can impact your commercial and non-commercial goals.
The full report is available from the DORA website, but in this post, you’ll find an overview of some key changes the survey used to collect data this year. You’ll also discover why we can welcome back the elite performance cluster and why this group can inspire improvements across many industries.
Software delivery performance
Software delivery performance gets measured using metrics that balance throughput and stability. Throughput is how quickly you can progress a change to production and how often you deploy. Stability is measured by the rate of failed changes and how long it takes to recover when things go wrong.
In traditional software development, the developers were responsible for throughput, and the operations team handled stability. There was an assumption that throughput and stability conflicted. If you made many changes and deployed more often, surely you’d break things more. The conflict between development and operations goals led to developers wanting to move faster and operations pulling on the reigns to slow things down.
The research has shown this assumption is wrong. High-performing teams demonstrate that you find throughput and stability together. The DevOps approach of breaking down the silos and sharing the responsibility results in the best performance against all 4 measures.
Once you know the answer, it’s easy to work out why this counter-intuitive approach works. If you can deploy many times a day, when you discover a fault in the software, you can quickly resolve it without expediting the fix. Sticking to a standard deployment pipeline during an incident reduces the chance of making a problem worse.
When you deploy software that has a single change, the deployment has lower risk and fewer unintended interactions than if it has 10 changes. This makes it less likely to result in a production issue because the risk increases in line with changes and the interactions between them.
The DORA metrics are the best-known way to measure software delivery performance.
There are 4 metrics for software delivery performance. There is also a reliability metric that extends the set to cover software delivery and operational performance. Operational performance increases the likelihood that software performance will impact organizational goals.
In the 2022 report, the researchers found 3 performance levels:
| 2022 Performance level | Lead time | Deployment frequency | Change failure rate | Mean time to resolve |
|---|---|---|---|---|
| Low | 1-6 months | Monthly to biannually | 46-60% | 1 week - 1 month |
| Medium | 1 week to 1 month | Weekly to monthly | 16-30% | 1 day - 1 week |
| High | 1 day to 1 week | Multiple times per day | 0-15% | < 1 day |
Each performance level shows the link between throughput and stability. When you improve one, you improve the other. This happens because the technical practices to improve throughput also positively impact stability. For example, if you deploy once a month manually, you need to automate the deployment to increase your deployment frequency. Automation removes manual errors introduced during the deployment, which reduces the change failure rate.
Changes to stability metrics
In the 2023 survey, the stability metrics changed to improve our understanding of software delivery performance. The DORA Community has been a thriving source of healthy discussions between researchers and practitioners. These conversations led to updates to change failure rate and time to restore.
Change failure rate
Previously, researchers collected the change failure rate using ranges such as “0-15%” and “16-30%”.
This year, respondents could select the exact number that matched their change failure rate. This means high-fidelity numbers replaced the buckets.
For example, instead of selecting “0-15%”, you could enter “5%”.
Time to restore
There were 2 problems with the mean time to restore (MTTR) metric. An unsuccessful change might cause a production fault, or it could be the result of an infrastructure failure. Representing this full range of incident types made it hard to establish software delivery performance in isolation of massive network faults and natural disasters.
In place of MTTR, the researchers asked people how long it took them to recover after a failed deployment. This made the measurement specific to faults introduced with a new software version or a deployment that impacted service (for example, because the checklist wasn’t followed correctly).
Software delivery performance changes
Last year, the performance clusters changed. The elite performance group didn’t emerge, and we wrote about why we think this happened.
This year, we welcome back the elite performers. The demographic information certainly hints that elite performance depends on professionals with more than 10 years of experience.
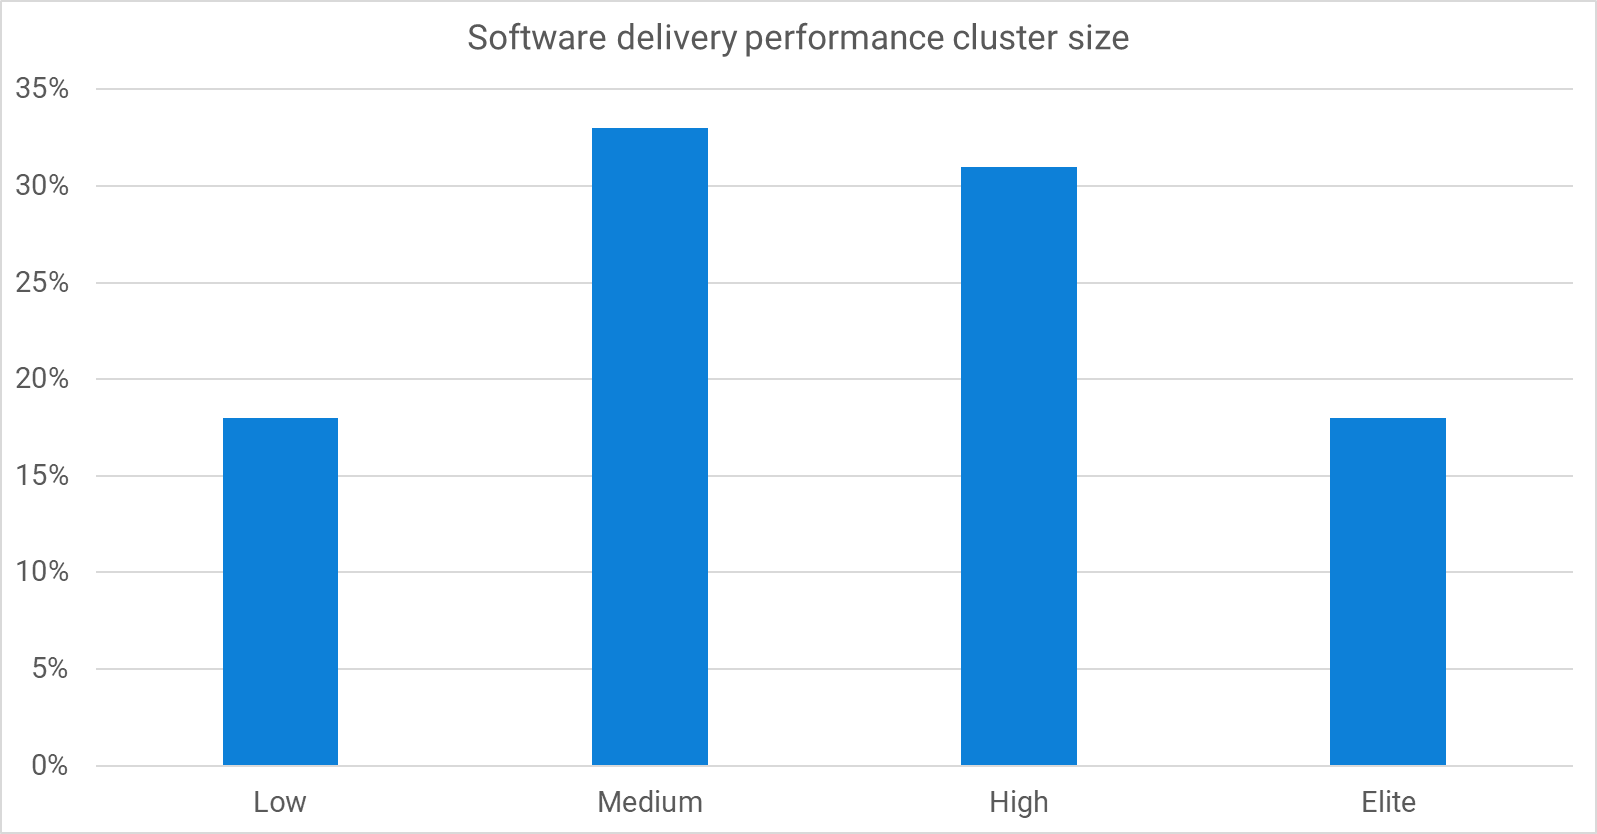
The software delivery performance clusters based on the new survey questions are:
| 2022 Performance level | Lead time | Deployment frequency | Change failure rate | Failed deployment recovery time |
|---|---|---|---|---|
| Low | 1 week - 1 month | Once a week - once a month | 64% | 1 month - 6 months |
| Medium | 1 week - 1 month | Once a week - once a month | 15% | 1 day - 1 week |
| High | 1 day - 1 week | Once a day - once a week | 10% | < 1 day |
| Elite | < 1 day | On demand | 5% | < 1 hour |
We’ve highlighted the differences from the 2021 clusters in bold. Compared to last year, the low-performance cluster has higher throughput and lower stability, but the trend of higher-performance clusters improving against both measures is as strong as ever.
How to use these clusters
With any software delivery metrics, the best way to compare performance is to focus on a single application over time. Comparing the performance between different teams and applications fails to account for many contextual differences. But looking at the performance of an application over time demonstrates the vector of change.
For software delivery, metrics should inform improvement activities rather than drive them. You should take an experimental approach to applying these capabilities, introducing or improving a capability, and observing its impact on the metrics. This is how you’ll find which practices impact your specific application and team.
The clusters can still be helpful as a reference for continuous improvement.
Opportunity identification
If your measurements are similar to one of the clusters but underperforming on one metric, you now have an excellent place to start improving.
For example, if you fit the medium performance cluster, except for having a higher change failure rate, what could you do to improve this? You can use the DORA Core Model to find capabilities that can help, such as test automation.
Aspirational examples
The other use for the clusters is in imagining what’s possible. The elite cluster represents organizations in many industries, including safety-critical and regulated industries. It’s possible to achieve this performance level without making things less safe and without taking shortcuts.
Conclusion
This year’s report gives us even more confidence that throughput and stability are partners, not enemies. The work you do to improve throughput also improves stability. Automating your deployment pipeline makes it easier to deploy more often and reduces lead time for changes, but it also significantly improves stability.
You can now have more confidence that experienced team members increase software delivery performance. The demographic changes over the past 3 reports show that the highest performance requires deep expertise.
You can find more insights in the 2023 State of DevOps Report.
Happy deployments!
Tags: