What are DORA and the DORA Metrics?
DORA (formerly known as DevOps Research and Assessment) is the team behind the Accelerate State of DevOps Report, a survey of over 32,000 professionals worldwide. Their research links the technical and cultural capabilities driving performance for software teams and the whole organization.
DORA recommends an approach that brings together software delivery and operational performance. They proposed 4 metrics for software delivery performance:
- Deployment frequency
- Lead time for changes
- Change failure rate
- Failed deployment recovery time
Deployment frequency and lead time for changes measure throughput, while change failure rate and failed deployment recovery time measure stability.
Multi-year research programs back these metrics. DORA metrics are exceptional in the type and volume of evidence supporting them.
Understanding the 4 DORA metrics
1. Deployment frequency
Deployment frequency measures how often you deploy to production or to end users. Your deployment automation tool can measure this, as it knows how often you deploy to production.
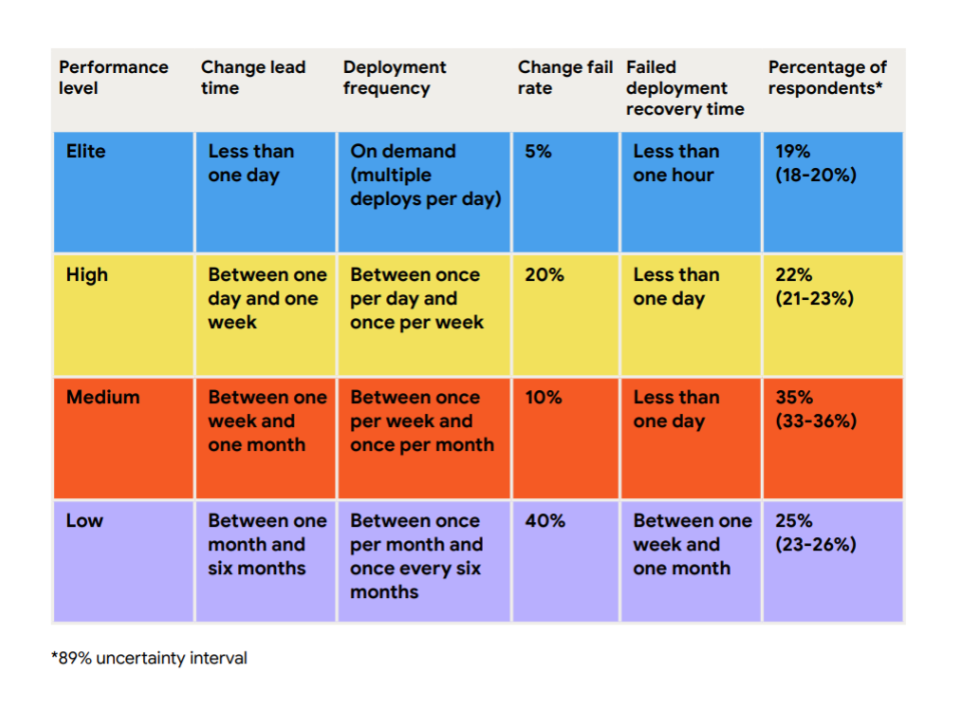
Here are DORA performance levels for deployment frequency:
- Low – between once a week and once a month
- Medium – between once a week and once a month
- High – between once a day and once a week
- Elite – on-demand (many deploys per day)
If you have manual tasks in your deployment pipeline, teams tend to deploy less often. This creates a vicious cycle because it increases batch size and makes the manual tasks a bigger effort. This trend towards larger batches deployed less often results in feedback arriving far too late.
DevOps encourages reversing this negative effect. By reducing batch size and automating the deployment pipeline, you can deploy more often. Feedback will arrive sooner, and you’ll be more likely to deliver valuable software.
2. Lead time for changes
There are many definitions of lead times in software delivery and manufacturing, so it’s worth being specific about the DevOps definition.
Lead time for changes is the time it takes for a code change to reach the live environment. We measure this from code commit to production deployment.
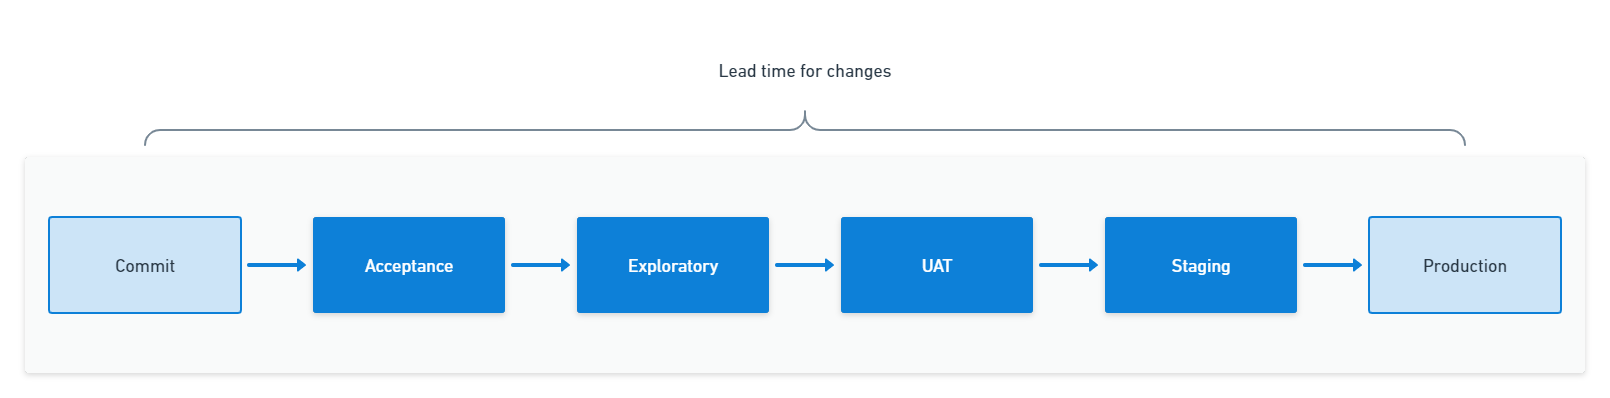
You can calculate the lead time for changes by pushing metadata to your deployment tool and using it to find the oldest commit in a deployment.
Here are DORA performance levels for lead time:
- Low - between one week and one month
- Medium - between one week and one month
- High - between one day and one week
- Elite - less than a day
Teams with shorter lead times tend to fix faults quickly because a resolution in the code won’t get stuck in a long deployment pipeline. A well-oiled deployment pipeline removes the need to fast-track a fix, reducing the risk of knock-on problems due to skipping key steps.
3. Change failure rate
Your change failure rate is the percentage of changes resulting in a fault, incident, or rollback. To track change failure rates, you must keep a log of all changes that cause a production issue.
Issue-tracking tools usually have a feature to link a bug request to the original change. You can use these to calculate your change failure rate. Otherwise, you can add a custom field to retrospectively mark a change as ‘failed’ to use in reporting.
Here are the DORA performance levels for change failure rate:
- Low – 64%
- Medium – 15%
- High – 10%
- Elite – 5%
Your change failure rate is context-specific. If you’re in an early stage of product development, you can encourage risk-taking and experimentation by aiming for a higher change-failure rate.
4. Failed deployment recovery time
Adjusted in 2023, failed deployment recovery time is how long it takes to get back into a good state after a bad deployment. The deployment might have caused a fault, or the software version may contain a critical issue you must address.
This metric doesn’t track production incidents caused by network problems, hardware faults, or other unpredictable events.
You can collect failed deployment recovery times from your deployment automation tool. You can also create a work item type for failed deployments in your task-tracking tools.
Here are the DORA performance levels for failed deployment recovery times:
- Low - between one month and six months
- Medium - between one day and one week
- High - less than one day
- Elite - less than one hour
Change lead times can impact recovery times, as a code change needs to move through your deployment pipeline before it can go live. If you hurry a change by skipping steps in the deployment pipeline, you increase the risk of unexpected side effects.
Suggesting an additional metric: Reliability
Reliability refers to teams meeting or exceeding their reliability targets. The State of DevOps Report research finds that operational performance drives benefits across many outcomes. Measuring reliability ensures that the end-user experience gets included.
The quality of your internal documentation is a key to high performance against the reliability metric. Teams with high-quality documentation were more than twice as likely to meet or exceed their targets. Documentation also improved performance against the other DORA metrics. You should measure reliability against the service level objectives of your software.
If you exceed service level objectives by too much or for too long, other systems start to depend on the higher service level you achieve. Rather than expecting downtime and handling it gracefully, many may assume your service will always be available. This causes problems when you experience an outage.
You can use short and deliberate outages to bring availability closer to the service level objective and test system resilience. This helps ensure other systems handle outages gracefully.
Main findings from the latest DORA report: Throughput, stability, and impact of AI on DevOps
Software delivery remains stable amid turbulence
The 2024 DORA report emphasizes that throughput and stability levels are generally steady across high-performing teams despite macroeconomic and organizational turbulence. The report attributes this resilience to strong engineering practices and cultural norms such as psychological safety, team autonomy, and clearly defined responsibilities. Teams that consistently apply these practices can maintain performance even during layoffs, budget constraints, or major organizational shifts.
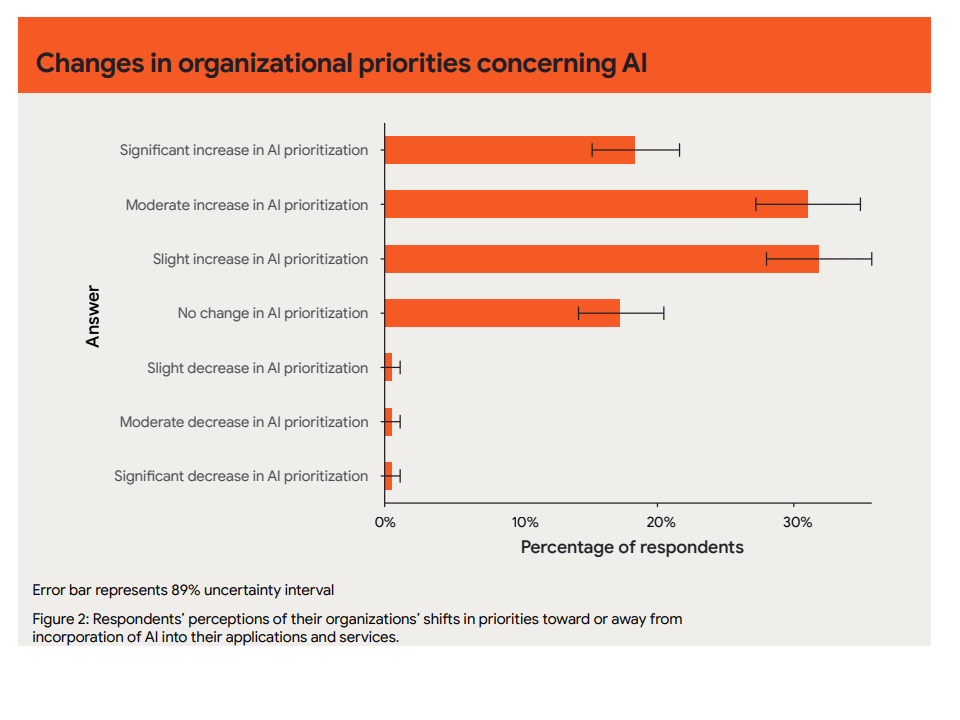
AI adoption accelerates, but its impact remains uneven
AI and automation tools—especially those supporting code generation, test writing, and documentation—are being adopted rapidly. The report found that AI tools help teams speed up low-level development tasks but have not yet translated into significant gains in DORA metrics like lead time or change failure rate. The uneven impact suggests that these tools are more beneficial in specific contexts, and their effectiveness often depends on how well they integrate with existing workflows.
Notably, the report underscores that teams that adopt AI successfully are those with solid foundational practices, such as Continuous Integration and automated testing. In contrast, teams lacking these foundations often fail to get value from AI tooling and may experience disruption instead.
Reliability gains come from documentation and team practices
Teams with high-quality internal documentation continue to outperform in reliability. The report quantifies this by showing that good documentation helps teams achieve higher compliance with their service level objectives. It also improves the other DORA metrics by reducing ambiguity in development and deployment processes.
Additionally, well-defined responsibilities and empowered teams (i.e., teams with decision-making autonomy and access to necessary tools) show stronger performance across all DORA metrics. This finding reinforces that operational excellence isn’t just about tooling—it depends equally on cultural and organizational structure.
Psychological safety and team identity drive performance
The 2024 report reaffirms that psychological safety—where team members feel safe to take risks and voice concerns—is among the strongest predictors of software delivery performance. Teams that report high levels of psychological safety consistently perform better across deployment frequency, lead time, change failure rate, and recovery time.
Strong team identity and clearly defined team boundaries also help. Teams with a strong sense of shared purpose and control over their work tend to deploy more frequently and recover from failures faster.
Future outlook: Focus on socio-technical systems
Finally, the report shifts its outlook toward holistic socio-technical systems. It advocates for organizations to consider technical practices (e.g., trunk-based development, CI/CD pipelines) and social dynamics (e.g., team structure, communication patterns). The future of high-performing software delivery lies not in any single tool or process but in the alignment between technology, people, and organizational goals.
What are the benefits of DORA metrics for your organization?
Evaluate software delivery performance
DORA metrics provide clear insights into software delivery performance for a team and application. By tracking key metrics, like deployment frequency, lead time for changes, failed deployment recovery time, and change failure rate, you can objectively measure the impact of process improvements and technological investments. This helps you identify the tools and techniques that work and those that need more attention, ensuring you allocate resources efficiently to drive continuous improvement.
Identify software delivery performance trends
You can use DORA metrics to analyze performance trends for specific applications and services. Comparing the metrics for an application over time shows where improvements are being made and areas where improvements have stalled. You can use these insights during retrospectives to identify bottlenecks or recurrent issues. The team can then implement targeted improvements to streamline their workflows.
Improve developer experience
The DORA metrics can be indicators of developer experience. Developers can feel frustrated by frequent production issues or having to wait a long time to see their changes go live. While many factors impact developer experience, the same capabilities that improve software delivery performance also improve it by reducing burnout and increasing job satisfaction.
Share good practices and tools across engineering teams
When teams share common measures, they can have productive discussions about the techniques, practices, and tools that help them achieve high performance. This helps teams propagate good practices throughout the organization as they can refer back to their impact on known good metrics.
How to calculate DORA metrics with examples
DORA metrics are meaningful when compared for the same application over time. This shows you the trend and extent of improvements, which is more important than assigning a performance group.
You may be tempted to aggregate many data points into a single number. The common method of calculating DORA metrics is to apply an average. Averages only tell a part of the story, so use visualizations to help you understand the spread of numbers represented, not just the average. You can use scatter plots or box-and-whisker charts for a deeper understanding of your data than you’ll get from a line chart of averages.
1. Calculating deployment frequency
Deployment frequency measures how often code gets deployed to production.
- Count deployments: Track the number of deployments in a given time frame (for example, week, month).
- Calculate frequency: Divide the number of deployments by the number of days in the period, then multiply by the desired frequency unit (for example, per day).
Formula: Deployment Frequency = Number of Deployments ÷ Number of Days
Example: If there are 30 deployments in 10 days, the deployment frequency is 3 deployments per day.
Tip: A valuable way to use deployment frequency in your organization is to track the number of weekly deployments per developer. To do this, divide the number of deployments by the number of developers. Using per-developer numbers helps you see problems as you scale and manage expectations when developers join or leave.
2. Calculating lead time for changes
Lead time for changes is the time it takes from committing code to deploying it in production. Here are the steps to calculate lead time:
- Record times: Note the time when code gets committed and when it’s deployed.
- Calculate lead time: Subtract the commit time from the deployment time for each deployment.
- Average lead time: Calculate the average lead time for all deployments.
Formula: Lead time for changes = Sum of all lead times ÷ number of deployments
Example: If commits took 2, 3, and 5 hours to deploy, the average lead time is (2+3+5) ÷ 3 = 3.33 hours.
Tip: Shorter lead times for changes help create a smooth flow of value and feedback. Short lead times also help when there’s a production fault as you can deploy a fix using your standard process instead of taking risky shortcuts to expedite a fix.
3. Calculating change failure rate
Change failure rate is the percentage of deployments that cause a failure. Here are the steps for calculating this metric:
- Count failures: Track the number of failed deployments.
- Calculate failure rate: Divide the number of failed deployments by the total deployments, then multiply by 100 to get a percentage.
Formula: Change Failure Rate = (Failed Deployments ÷ Total Deployments) × 100
Example: If 2 out of 20 deployments failed, the change failure rate is (2 ÷ 20) × 100 = 10%.
Tip: Where people depend more on the software, you’ll want to achieve a lower change failure rate. Your deployment pipeline, not policy constraints, should be the primary way you reduce failures caused by software changes.
4. Calculating failed deployment recovery time
Failed deployment recovery time measures the average time to recover from a failed deployment. Here are the steps to calculating this metric:
- Record recovery times: Note the time when a failure first impacts users to when it gets resolved.
- Calculate recovery times: Sum all recovery times.
- Calculate the metric: Divide the total recovery time by the number of failures.
Formula: Recovery Time = Total Recovery Time ÷ Number of Failed Deployments
Example: If it took 1, 2, and 3 hours to recover from 3 incidents, the failed deployment recovery time is (1 + 2 + 3) ÷ 3 = 2.
Tip: Because failed deployment recovery times don’t have a normal distribution, averages can be misleading. When reviewing your data to find improvement opportunities, a scatter plot will help you see the outliers and trends.

Tony Kelly is a DevOps marketing leader who drives innovation and awareness of the latest trends in Continuous Delivery.
Limitations and criticism of the DORA metrics
While DORA metrics reliably measure your ability to deliver software, the research behind them and the broader DevOps community emphasize several limitations that organizations must understand to use these metrics effectively.
Misusing DORA metrics for team comparisons
In October 2023, the DORA team cautioned against using these metrics to compare teams. Creating league tables leads to unhealthy comparisons and counterproductive competition. When organizations can access seemingly comparable numbers, the temptation to set inappropriate performance targets becomes almost irresistible. This pressure forces teams to over-optimize less critical applications or find ways to game the system rather than focus on genuine improvement. As Goodhart’s law reminds us, “When a measure becomes a target, it ceases to be a good measure.”
Metrics track progress, but capabilities drive success
DORA metrics provide valuable signals about your software delivery performance and help you understand improvement trends over time, but the numbers themselves don’t solve underlying problems. Real success requires building a generative culture and establishing continuous improvement processes that address your organization’s unique challenges. While DORA research identifies specific practices and capabilities that may help, only through your own experimentation can you discover what truly works for your team and context.
Software delivery is just one piece of the puzzle
DORA metrics shouldn’t be your organization’s only measurement approach—they’re not even the sole focus of DORA’s research. Their popularity stems from software delivery being such a common organizational bottleneck. While these metrics excel at measuring and improving software delivery performance, organizations need comprehensive measurement and improvement strategies across their entire value stream to achieve broader success.
DORA doesn’t share the data
DORA doesn’t publish raw survey data due to privacy concerns, as the combination of demographic and organizational information could result in specific companies or individuals being identified. Instead, the team provides the survey questions used each year, enabling organizations to run their own experiments within their unique contexts and validate findings for their specific situations.
Addressing survey method concerns
Critics often question the reliability of survey-based research, but well-designed survey instruments actively work to reduce bias and avoid leading respondents toward particular answers. Surveys often provide the only practical research method for understanding complex socio-technical systems like software delivery, and when properly executed, they produce robust and actionable insights.
Lagging indicators with predictive power
DORA metrics function as lagging indicators of software delivery performance, similar to how weight measurement reflects the delayed results of diet or exercise changes. However, these metrics also demonstrate predictive value, correlating with broader organizational performance and employee wellbeing outcomes, making them valuable for assessment and forecasting.
The challenge of proving causation
Establishing clear cause-and-effect relationships between capabilities, performance, and outcomes is one of the most challenging aspects of organizational measurement. Teams that choose practices like Continuous Delivery might naturally include people who perform better on DORA metrics regardless of the practices themselves. Organizations can address this challenge by establishing baseline performance measurements and tracking changes over time as they implement improvements, creating their own evidence of what works in their specific context.
Implementing DORA metrics
The one thing that’s worse than a team trying to improve without metrics is one that’s driven by metric-based targets. When you implement DORA metrics, you need to make sure you keep the work system healthy. The metrics should guide improvement efforts rather than drive team performance.
Setting up systems to collect data takes time and money, so you need to invest wisely by identifying an acceptable level of precision and accuracy. Using consistent measurements over time is better than constantly adjusting systems and data, even if they aren’t as accurate.
Integrate issue-tracking, Continuous Integration, deployment, and monitoring tools
You might store data in several systems. For example, your Continuous Integration (CI) tools may know when someone committed a change to version control, but it might not know when it got deployed to production. You can integrate the data into a unified system to collect information from tools like issue trackers, build servers, deployment platforms, and monitoring tools. You may find that adding custom fields can help you categorize and analyze data.
Where integrating these systems requires too much effort, you can split a metric into manageable parts. For example, if you can’t get a view of lead time for changes, you might use the build time from your CI server, and the time from package upload to production deployment from your Continuous Delivery platform.
Regular review
Establishing a routine for reviewing your DORA metrics is important for continuous improvement. Schedule fortnightly or monthly review meetings to evaluate the collected metrics. During these reviews, analyze trends and patterns in your deployment frequency, lead time for changes, change failure rate, and recovery times.
Identify any recurring issues or bottlenecks impacting performance. For example, if lead times are consistently high, investigate whether the delay is due to lengthy code reviews, inefficient testing processes, or other factors. Similarly, if the change failure rate is high, examine the root causes of deployment failures and address them promptly.
You can use the DORA Core model to find capabilities that will help you resolve the problems you discover.
Feedback loops
Use the insights from your DORA metrics reviews to provide actionable feedback to your development and operations teams. Encourage open communication and collaborative problem-solving to address bottlenecks and inefficiencies identified in the review process.
For example, if deployment frequency is lower than desired, discuss potential solutions like increasing automation in the deployment pipeline or reducing batch sizes. Similarly, if the change failure rate is high, collaborate with the team to find common failure points and develop strategies to mitigate them. This could involve improving testing procedures, enhancing code reviews, or refining rollback or recovery mechanisms.
Visualization and reporting
Visualization tools like Grafana, Power BI, Tableau, or advanced deployment automation tools can create live dashboards for your DORA metrics. Visual representations of metrics like deployment frequency, lead times, failure rates, and recovery times make it easier to understand performance trends and identify areas for improvement.
Make sure dashboards update in real time to reflect the latest data. This provides a clear and current view of your software delivery performance. These visualizations can highlight critical issues at a glance, enabling quick decision-making and proactive management. For example, a spike in the change failure rate can prompt immediate investigation and remediation efforts.
Improve your DORA metrics with Octopus Deploy
Octopus Deploy’s Insights feature is based on the DORA metrics and also includes deployment duration statistics. The insights inform your improvement process and let you know when something might need attention. There are trend indicators that highlight changes that might be useful starting points.
You can read more about deployment insights
Get started with Octopus
Make complex deployments simple
Help us continuously improve
Please let us know if you have any feedback about this page.