
For the past 2 years, we’ve been talking to customers about their biggest headaches when deploying to Kubernetes.
A recurring theme has been the challenge of knowing what’s actually happening with your applications at any given moment.
With Kubernetes, things can change unexpectedly. A Pod might go down, your cluster could run out of resources, or something might break even though your deployment was successful. When this happens, our users would need to look for information in other tools or use commands like kubectl logs to diagnose what went wrong.
But most developers aren’t Kubernetes experts and don’t feel confident using kubectl. They often have to wait for a platform team with specialized Kubernetes knowledge, leading to frustrating delays. Platform teams can get stuck in firefighting mode and lose valuable time for more strategic projects.
With these challenges in mind, we aimed to create a tool for developers to troubleshoot their Kubernetes applications.
Here’s how we designed Kubernetes Live Object Status and how a few unexpected discoveries shaped our choices.
Integrating versus separating live status
The first big choice was whether to create separate dashboards for live status or integrate it into our existing dashboards. We used low-fidelity wireframes to explore both options and get early feedback from Octopus leaders.
Ultimately, we didn’t want to create a separate space for Kubernetes. Our users often have many different applications they want to see on a single screen.
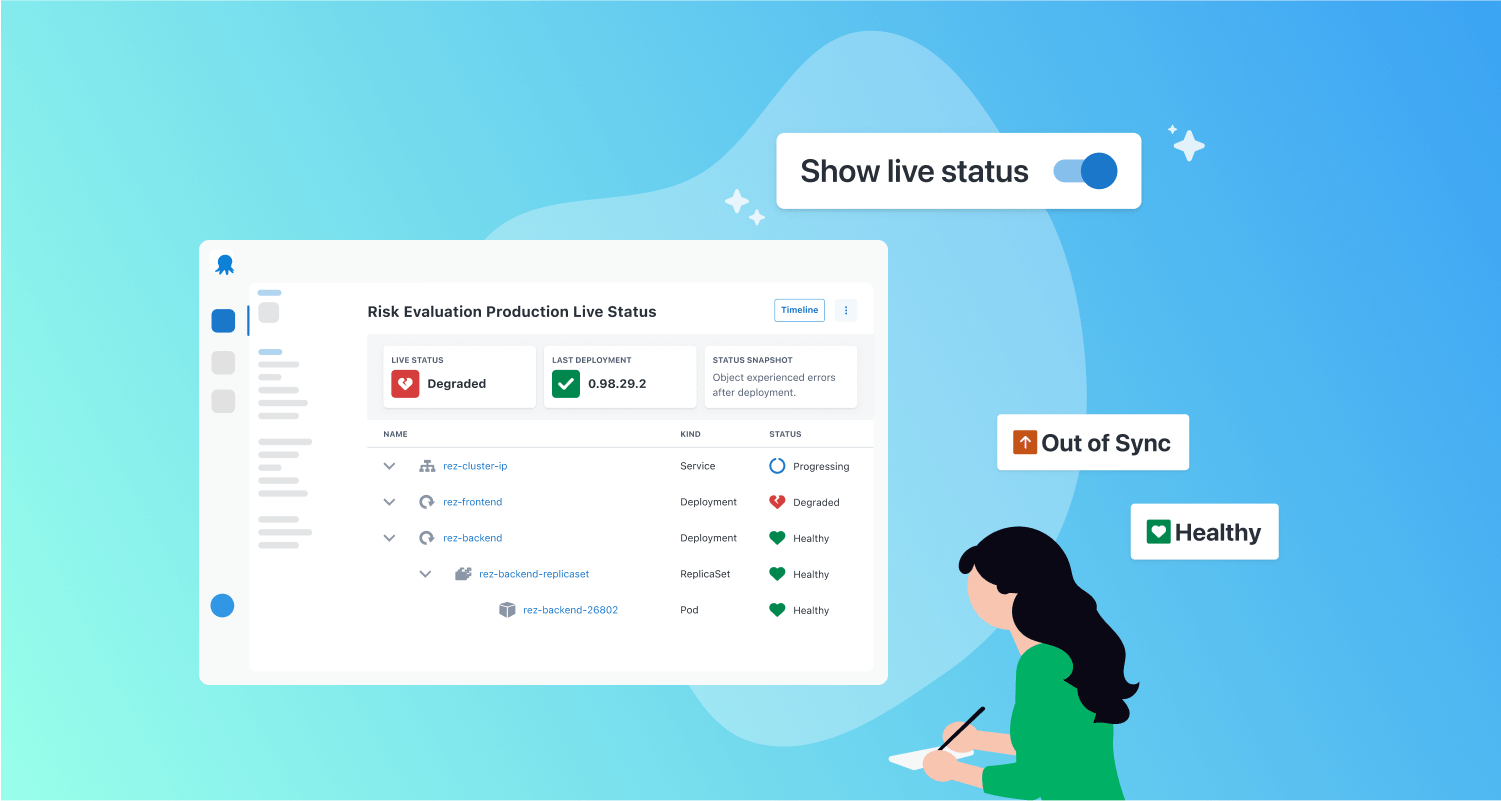
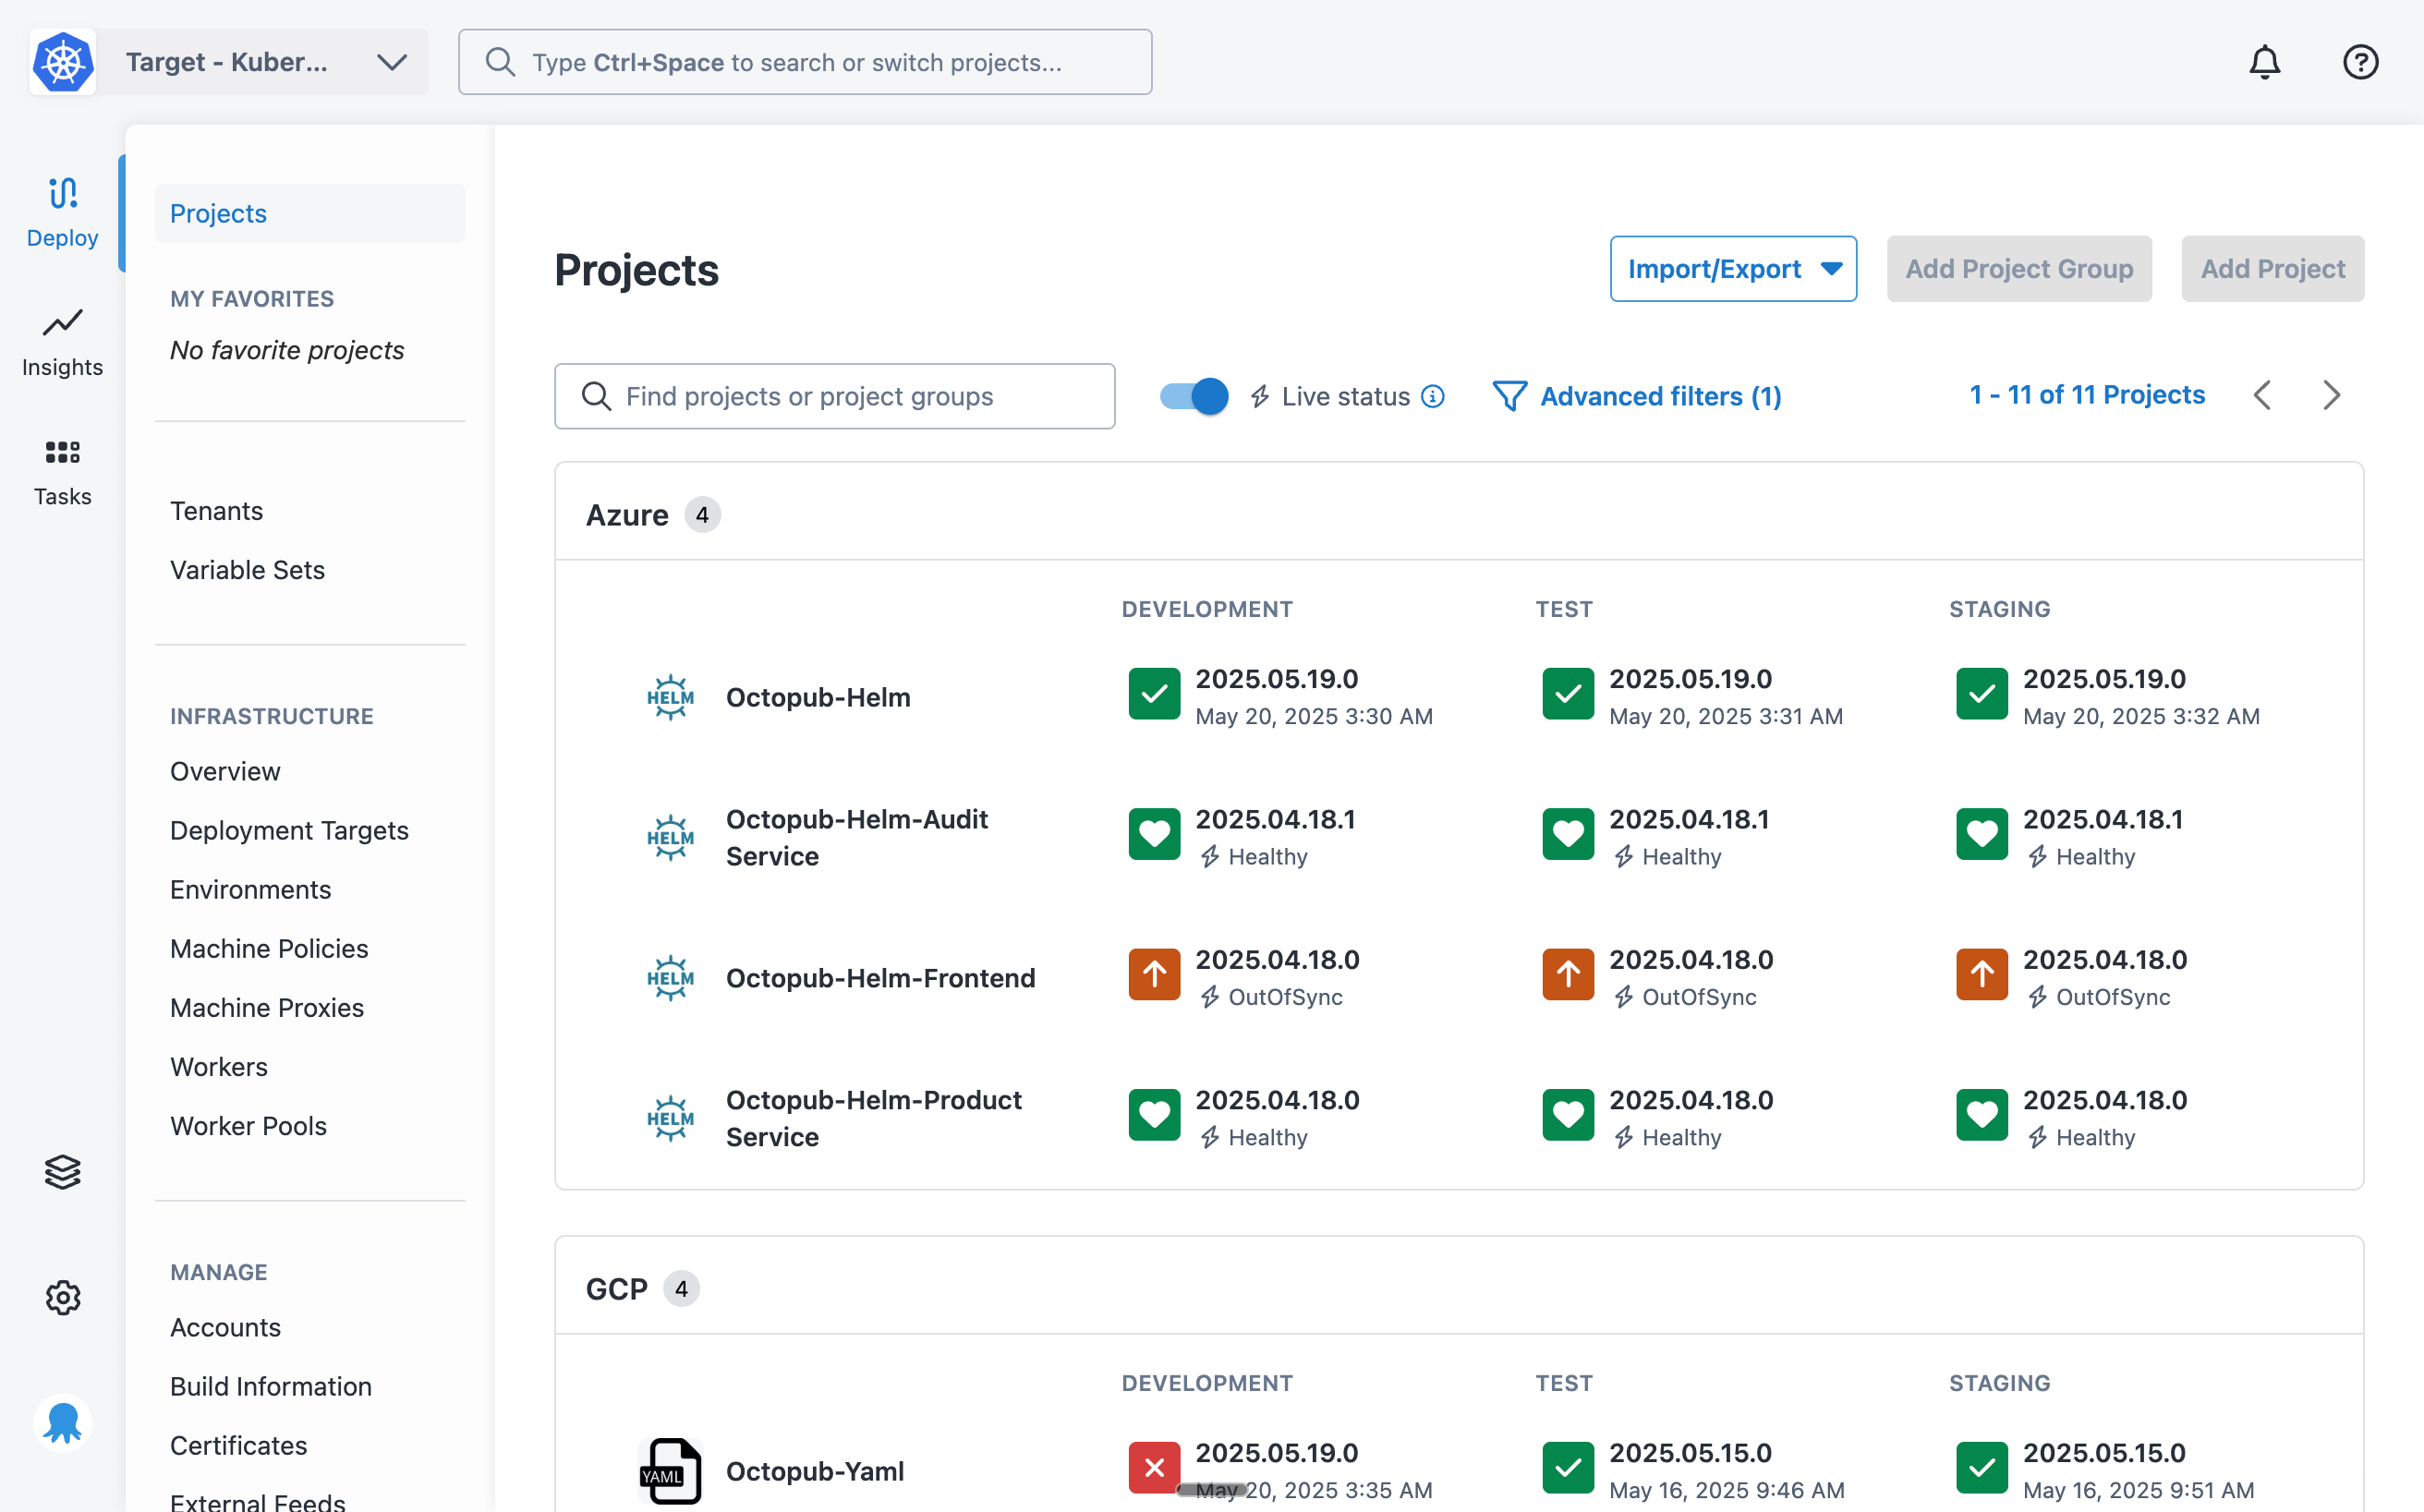
We decided to let you toggle between live and deployment status on your main Octopus dashboard. To improve usability, your preference gets saved in the browser for your next visit.
Integrating live status into existing dashboards lets us extend it to other types of applications in future. While that’s not currently on our roadmap, we’d love to hear if it’s something you’d find useful.
Using established status indicators
Instead of creating new status indicators, we started with existing statuses from Argo CD, a popular open-source Kubernetes tool. We knew that we had an upcoming project to integrate with Argo CD and leveraging its statuses would let us integrate more seamlessly.
However, we had to make a few modifications to fit the Octopus model. Our team added extra statuses for applications because Octopus deployments determine the Kubernetes desired state. After a successful deployment, we compare the desired state with the live status to determine if an application is out of sync.
We also decided to combine the Argo CD sync and health status to simplify it for users.
We ended up with 2 sets of live statuses, one for applications and one for Kubernetes objects.
Evolving with user feedback
During the first few weeks of EAP, we encountered an issue where customers saw out-of-sync more often than they expected. It turns out that resources can regularly be out of sync for reasons that aren’t actually important.
We quickly realised that we needed to separate sync status from health status instead of combining them.
Our first instinct was to simplify the experience, but that’s the reality of building real software—once it’s out in the wild and customers start using it, you realize there’s complexity for a reason.
Our team did a quick pivot to separate health status from sync status for both applications and objects.
You can read our documentation to explore the updated status model.
We also introduced a setting that prioritizes health status on the dashboards as a default. We’re planning extra work in this space to give users more granular control and better visibility of both statuses.
This surprising lesson is a great example of why we try to ship early and get customer feedback as soon as possible. It’s something you can’t easily test or replicate with a prototype and a usability study.
Adding a new live status page
In addition to the dashboards, we created a dedicated live status page for each project, environment, and tenant combination. This gives you an easily shareable link for a specific application that you can bookmark or share with your team.
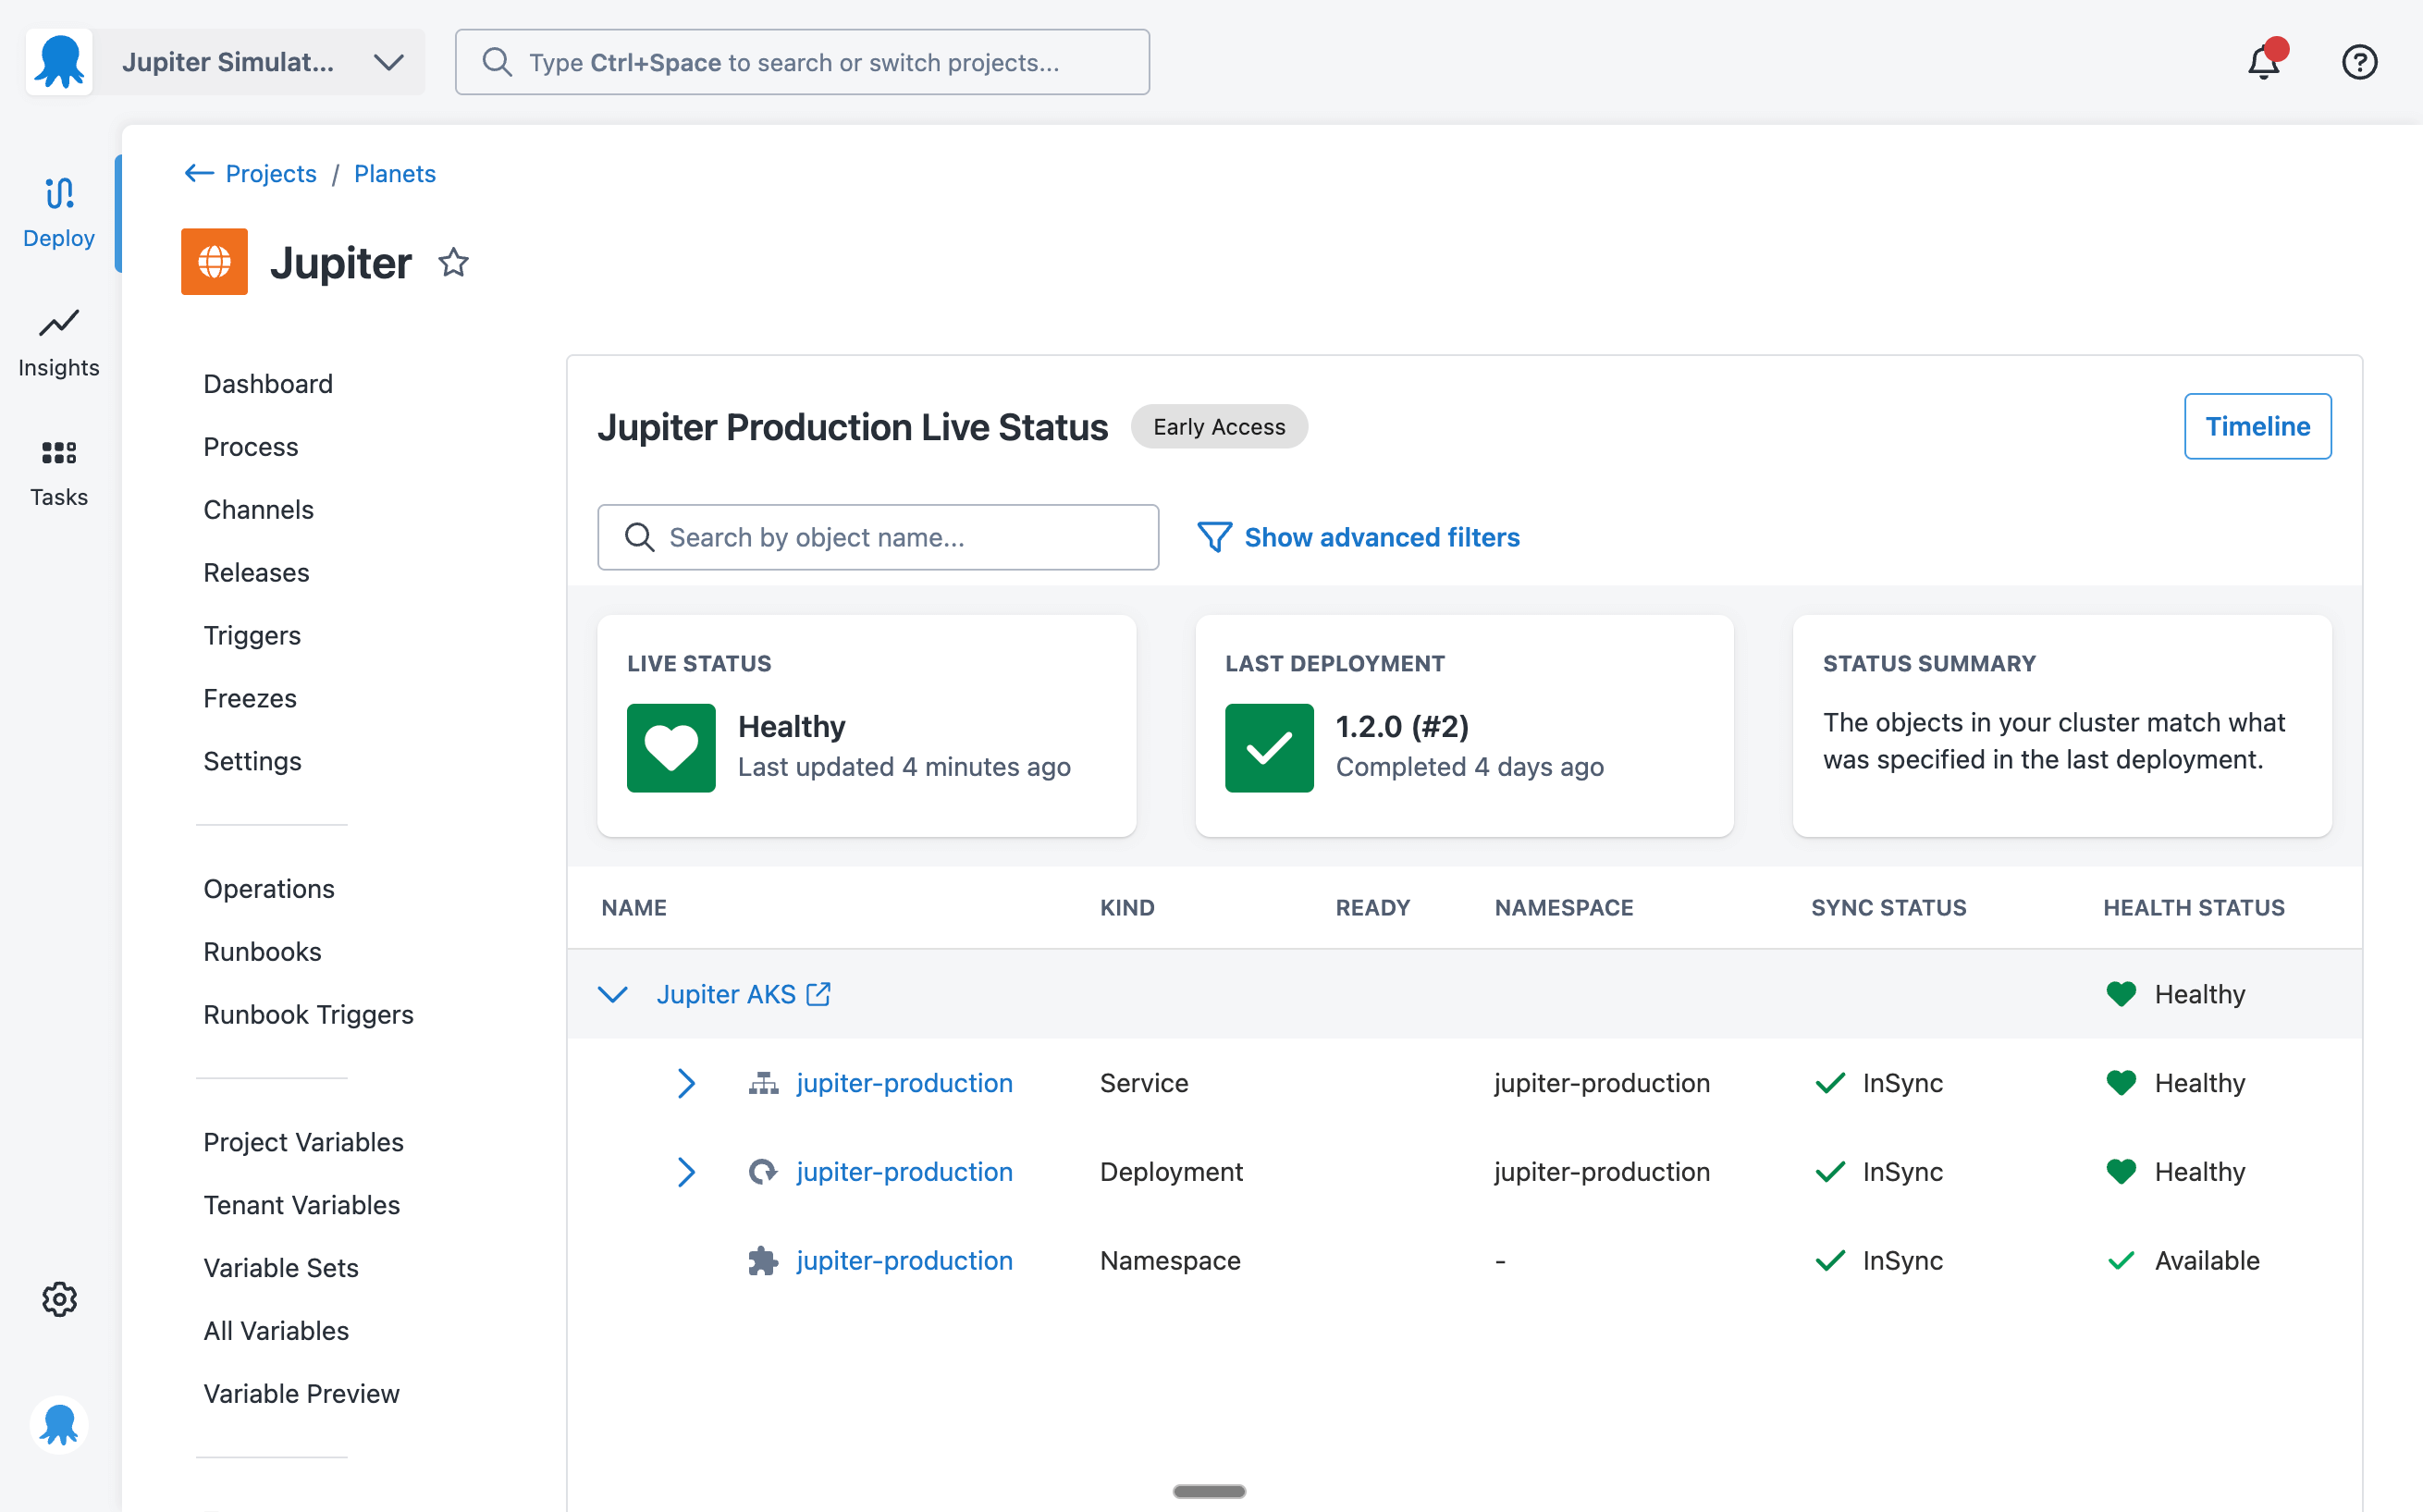
Choosing the object visualization
We considered multiple ways to visualize your Kubernetes objects and key information about them.
Some tools use flow-style diagrams to show the hierarchy and relationships between objects. But this approach, while visually appealing in demos, can get very messy and hard to read at scale. It was important to consider what this would look like with hundreds or even thousands of objects.
That’s why we opted for a tree grid, which gives us the best of both worlds. It lets us show information with high density, so even if you have many objects, it’s still easy to scan. You can also use the advanced filters panel to reduce the list to objects with specific states and kinds. And it still shows the relationship between objects through hierarchical expanders.
Diagnosing object issues
The key to creating a single place to troubleshoot is to provide enough information to find the cause without needing to switch between tools.
During a usability study for this feature, we asked users to troubleshoot an application, starting from the main dashboard. Those were the only instructions they received.
Users immediately navigated to the live status page and looked for events and logs without any extra prompting. This was surprising to a few of us, but not to our team’s Senior Cloud Engineer, who had spent years debugging Kubernetes issues himself.
The usability study made us realize that events and logs were key capabilities we needed to deliver on this feature’s promise.
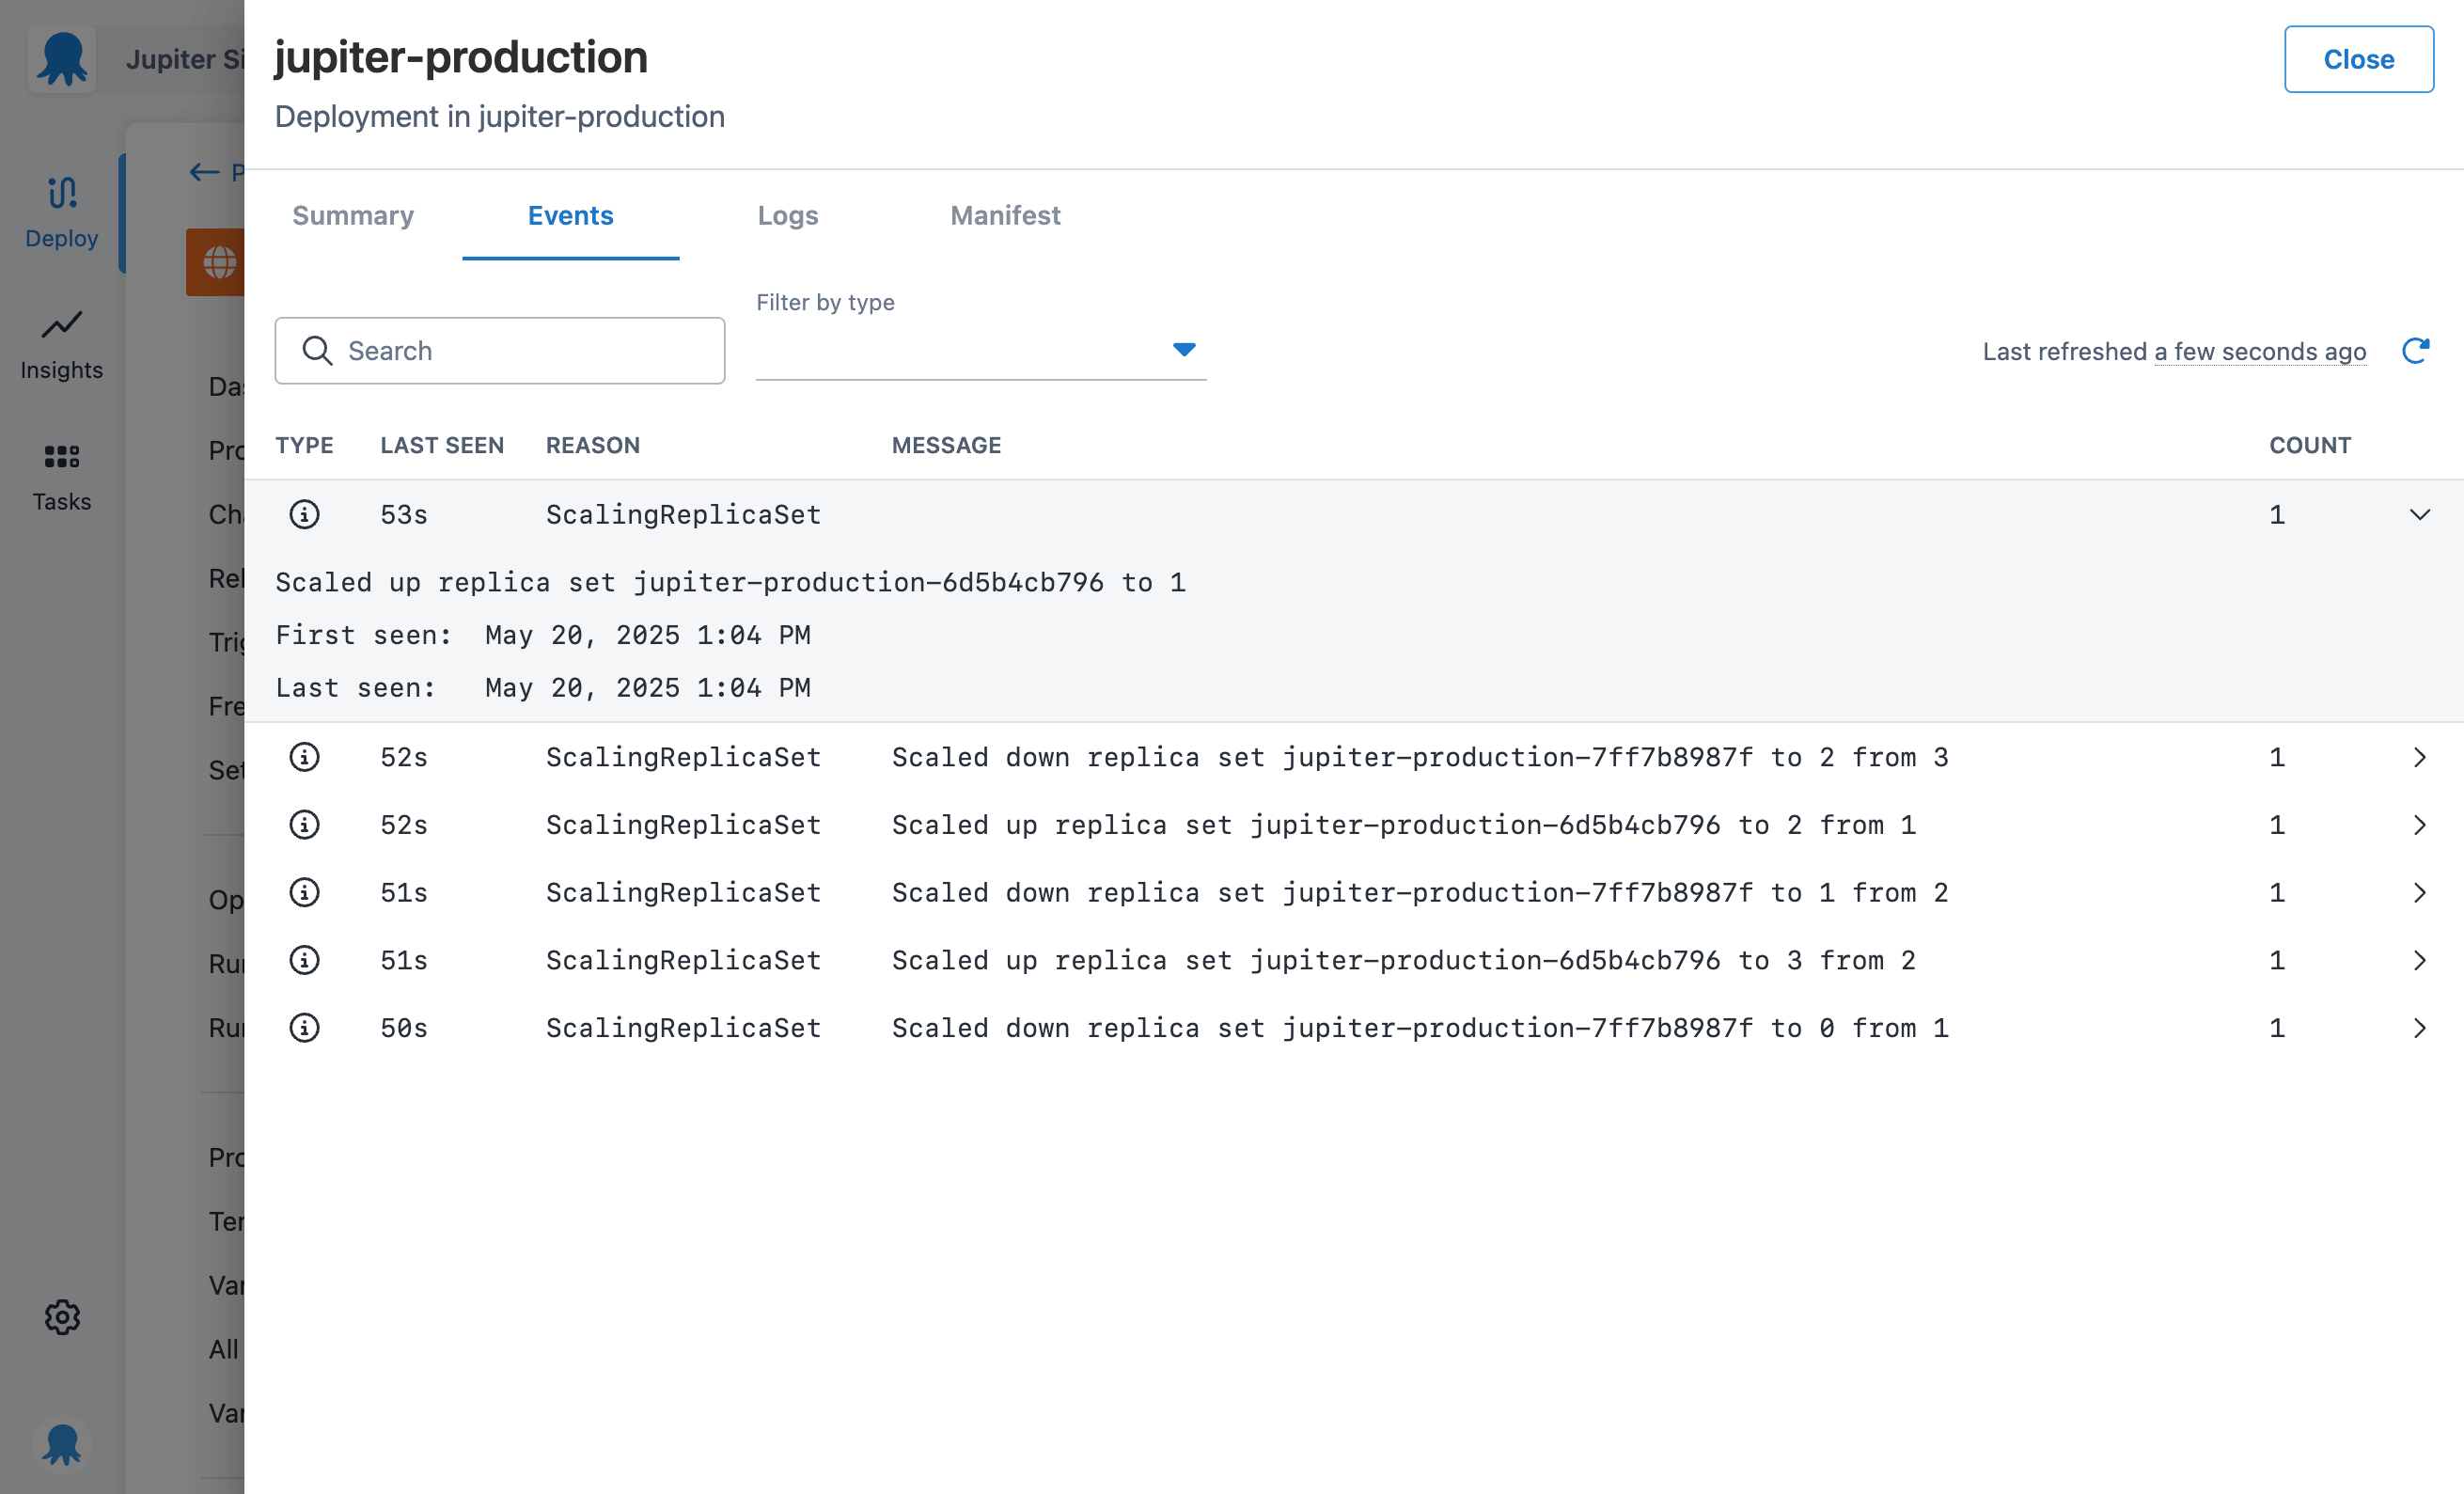
When viewing the live status page, you can now click on an object’s name to get more details. This action opens a drawer with 4 tabs:
- Summary
- Events
- Logs
- Manifest
Interacting with Kubernetes logs and events
Kubernetes events can be quite verbose, so we wanted to make it easy to find the issue you’re looking for. It was important to add filters based on the type of event, especially if you’re only looking for warnings.
The event row shows a snippet of the message to make it easily scannable. But we also have an expandable element that lets you read the full message and see the first and last seen dates.
The engineers on our team felt strongly that it was important to deliver a great experience interacting with logs. We added a few nice touches, like highlighting a row when you hover over it and including toggles for:
- Showing the previous container
- Timestamp visibility
- Line wrapping
We opted to keep things simple for refresh behavior and give users more granular control.
Because the logs are live, we didn’t want things to move and scroll while you were looking at them. We decided to provide a refresh button you can use to update the logs without unexpected behavior.
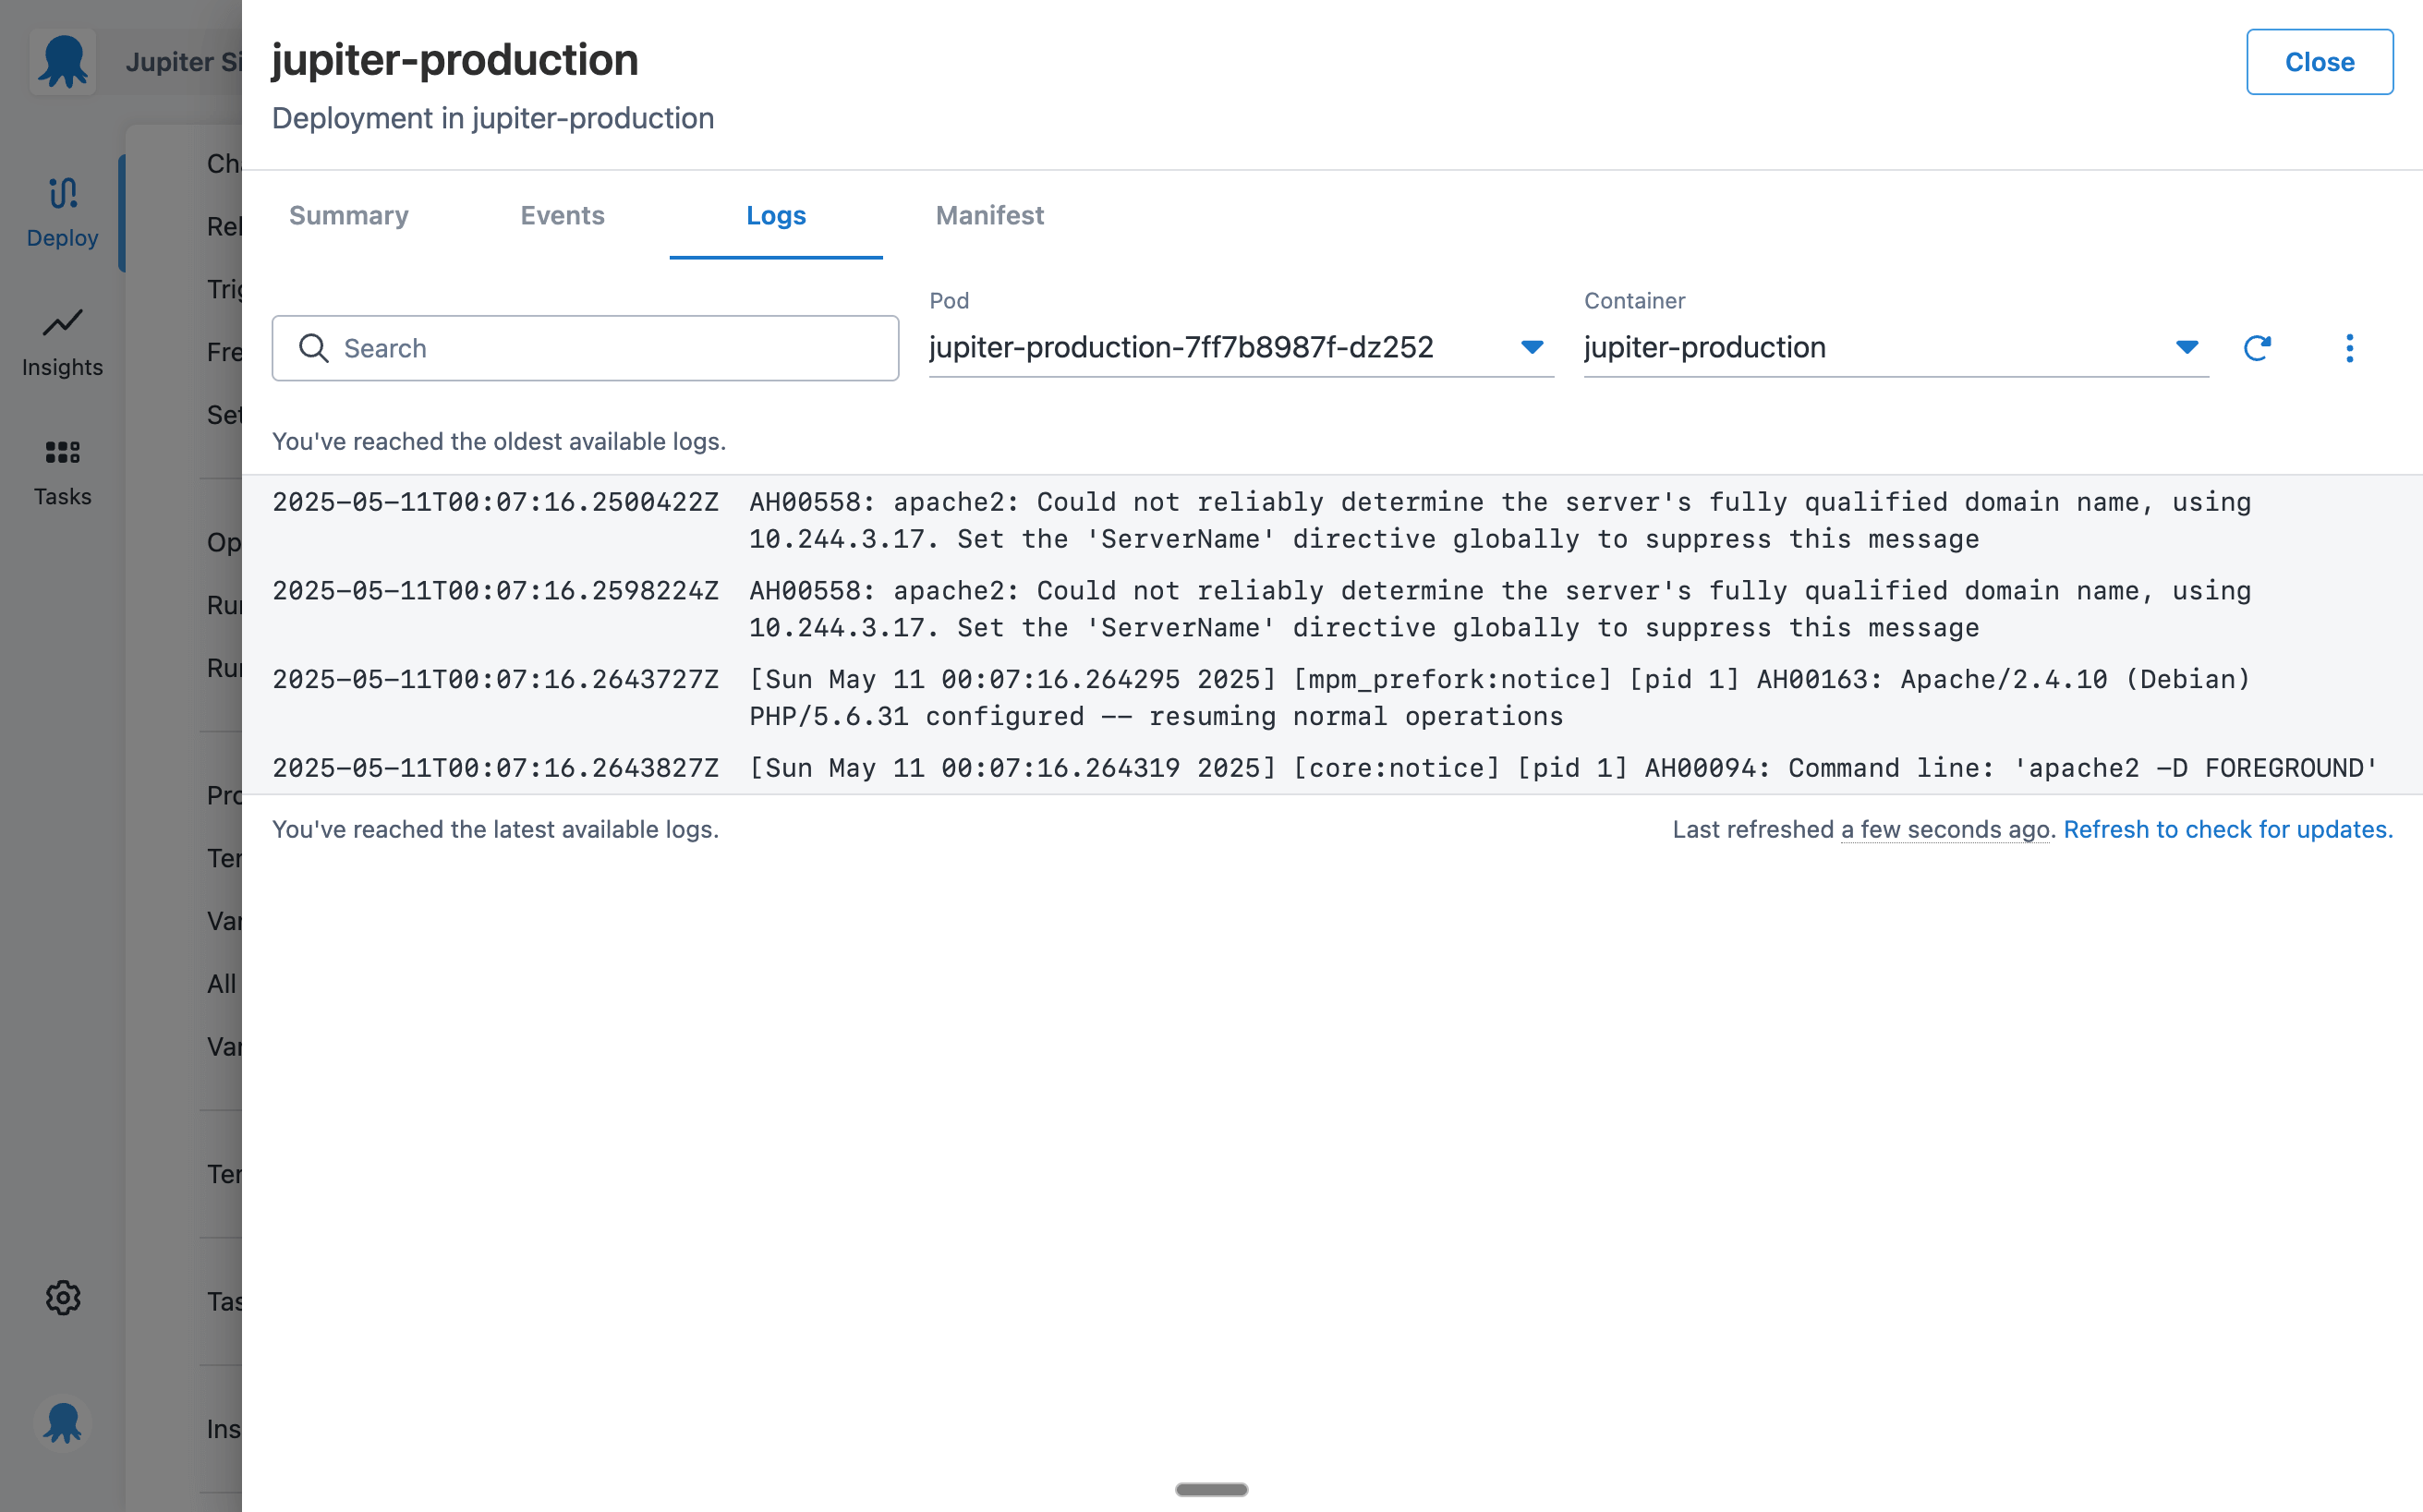
A small but significant design choice, championed by the engineers on our team, was using a monospace font. This differentiates the actual machine output from the rest of the Octopus interface.
We wanted users to know that this was the raw output from their cluster and that they could trust it.
Inspecting and comparing manifests
On the Manifest tab, you can see the YAML currently running in your cluster and compare it to your last deployment.
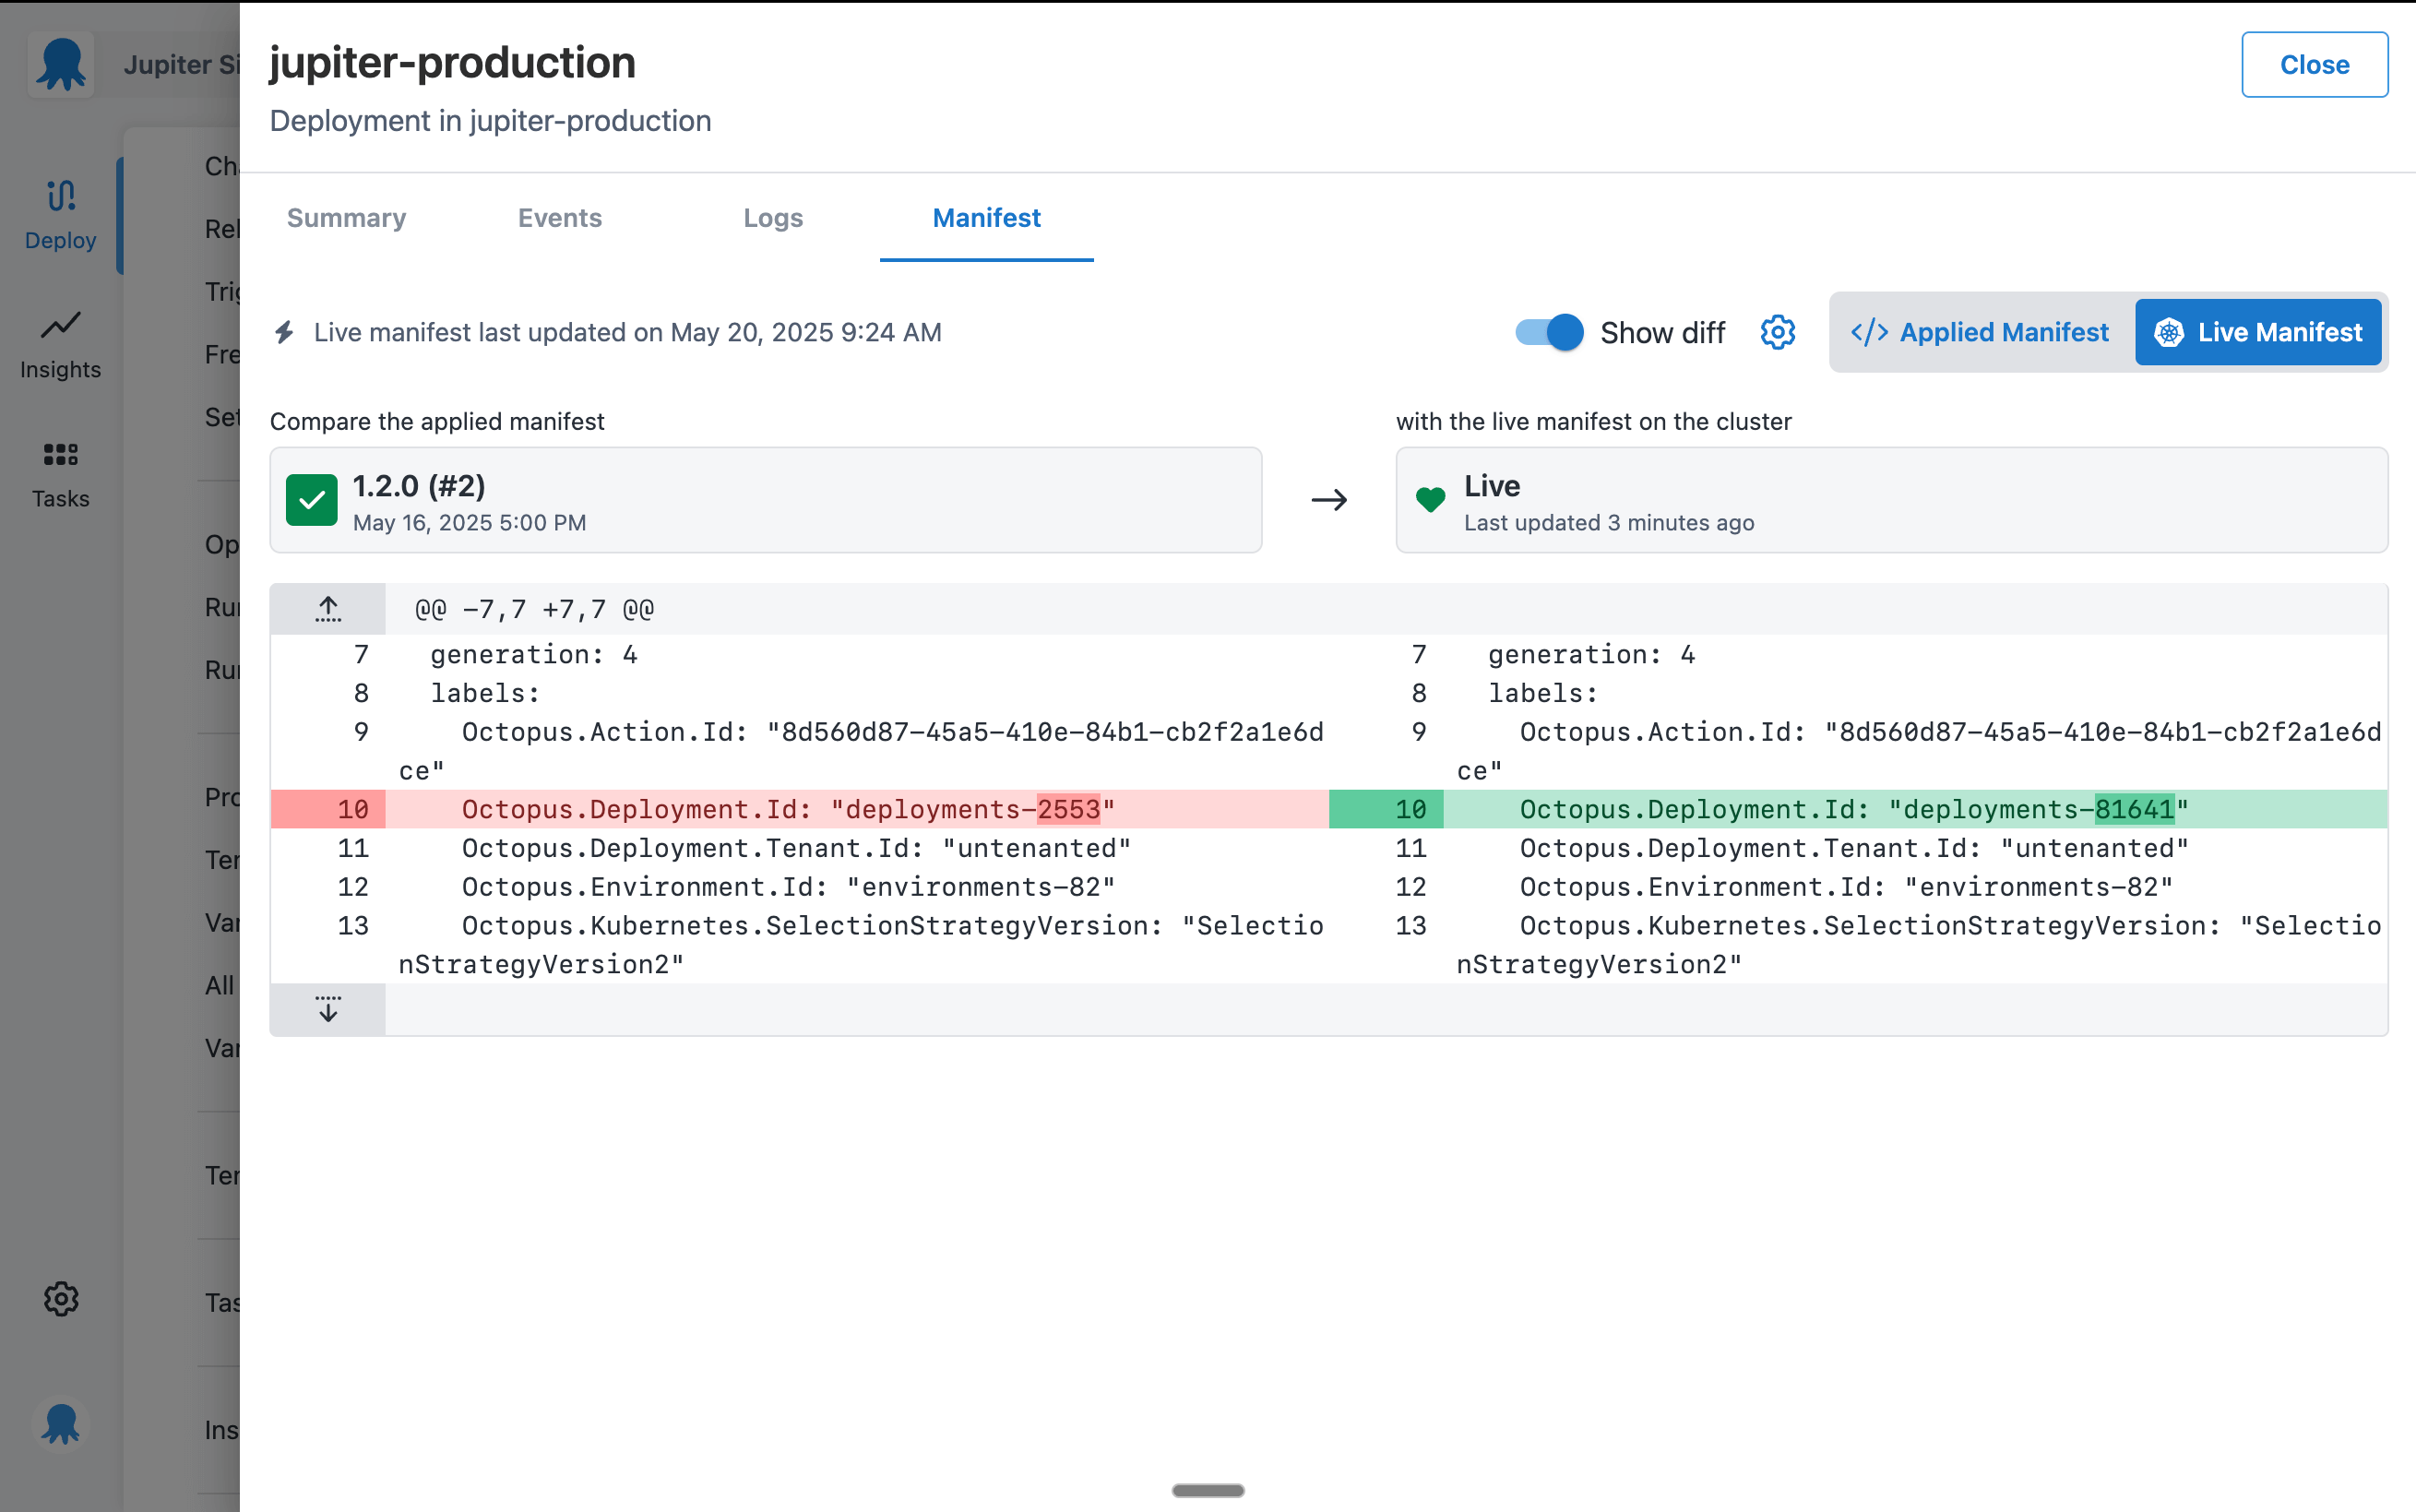
You’ll notice the diff view looks quite similar to other developer tools you’ve used before. That’s on purpose.
The fourth heuristic of Jakob Nielsen’s ten usability heuristics is to maintain consistency and adhere to standards. We worked from the assumption that our users spend more time in other tools than they spend using Octopus.
This means there are conventions from other tools that our users have already gotten used to. Instead of making you learn a new way to do things, we tried to incorporate existing patterns from popular tools you interact with daily.
That’s exactly what we did with the design for diffs.
A surprisingly useful addition: The deployment timeline
We originally created the deployment timeline to simplify navigation between Octopus deployments and the live status page.
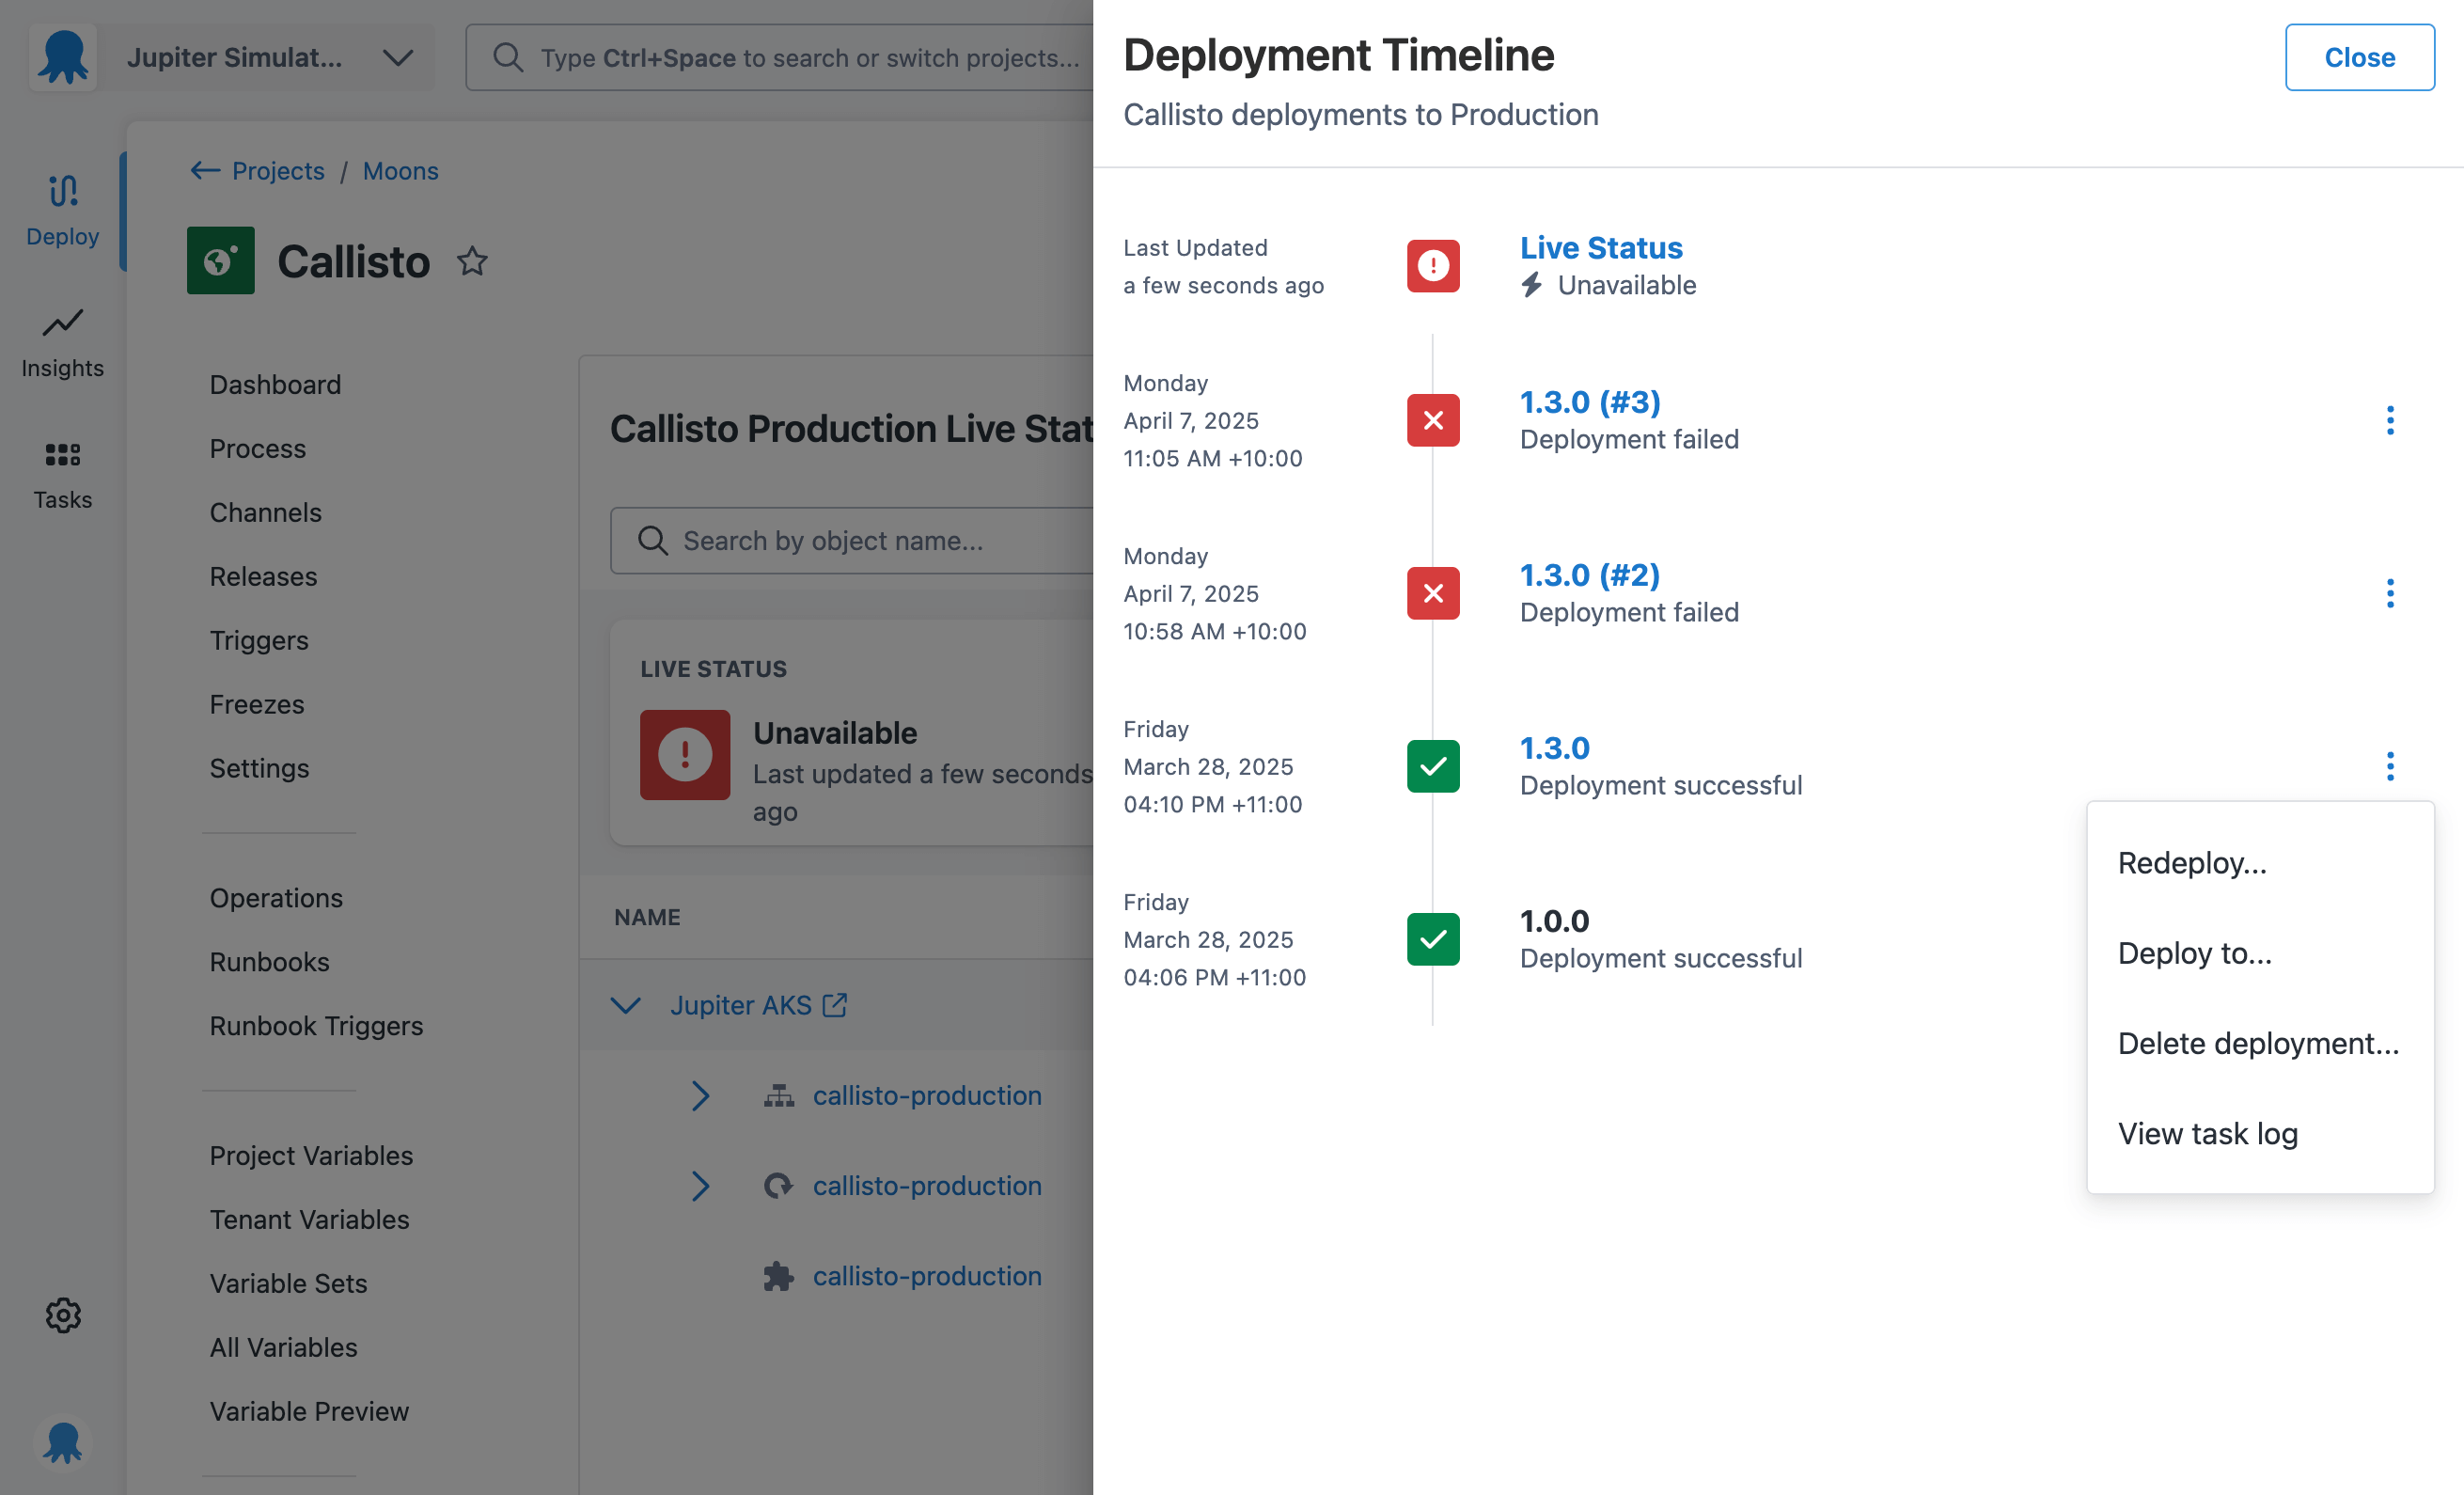
After sharing a mockup in our internal Slack, Paul Stovell, our CEO, commented that we should add a redeploy button to it. That would let you quickly roll back to a previous successful release if you see an issue with the live status. That’s how we (accidentally) designed a feature that helps close the loop from diagnosing an issue to actually fixing it.
This project had many interesting twists and turns, but my favorite has to be the surprising usefulness of the deployment timeline.
Being able to diagnose an issue is helpful, but redeploying and seeing your application running again takes it a step further. Empowering developers to fix their own apps is exactly why we built Kubernetes Live Object Status.
Conclusion
I hope this post has given you a fun behind-the-scenes look at how we design new features at Octopus.
We talk to customers, try out different solutions, test them, and release small iterations so we can get feedback quickly.
Sometimes, we learn unexpected lessons when our features get used in the real world, and sometimes, serendipity leads to a great idea.
How to get Kubernetes live object status
If you’ve used the feature and have feedback to share, please send us a message in the #kubernetes channel in our Community Slack. We’d love to hear from you.
If you haven’t tried it out yet, you can install the latest version of the Kubernetes agent. It includes the Octopus Kubernetes monitor, which gets live status from the cluster.
Happy deployments!
Tags: