
Kubernetes has a gift for making simple problems look complicated, and complicated problems look simple. When something breaks, you often see symptoms completely unrelated to the real cause of the problem. This leads to a problem I like to call “blaming the network team”, where problems end up being diagnosed by the wrong engineers for a given issue.
This is a real problem in the industry - not only for large enterprises, but also for smaller organizations that are transitioning from “Steve-based deployments”, where teams are learning to work separately yet still together.
I’ve personally experienced this dichotomy during my time as an engineer, working on both software and infrastructure, so I’m going to tell a story from two perspectives: the infrastructure engineer who initially looked at an issue, and the software engineer who was able to help solve the problem. It’s based on a real-world issue I experienced at a previous company I worked at, though I had much less fun solving it in real-time than writing this blog post.
I’ll discuss the tools used, the rabbit holes I dove into, and how I (eventually) learnt from our mistakes. Ultimately, discussing this will help others learn from my mistakes and enable teams to work together more effectively.
The backstory
The application that started it all is a GraphQL “gateway”. Written in Node.js, its job is to receive requests from clients, then connect to various backend services to retrieve data, stitch it together, and send it back. To say it’s in the critical path is an understatement - if it’s unhappy, so are customers.
One Thursday morning, it became very unhappy.
We started to receive reports from customers about timeouts and error messages. Our support team had a look at the issues they were seeing and immediately escalated to the infrastructure team - they were seeing strange errors:
Error: getaddrinfo EAI_AGAIN accounts.production.svc.cluster.localThe support team saw getaddrinfo, googled the problem, and quickly decided it was a DNS problem - time to page the infrastructure engineer!
Part 1: The Infrastructure Investigation
When you’re the infrastructure engineer and DNS errors appear, you need to move quickly. DNS is fundamental, especially in Kubernetes, where it’s often used in lieu of service discovery.
Starting With What You Know
First things first: are the CoreDNS pods actually running?
❯ kubectl get pods -n kube-system -l k8s-app=kube-dns

NAME                       READY   STATUS    RESTARTS   AGE
coredns-7c65d6cfc9-grq72   1/1     Running   0          2d20h
coredns-7c65d6cfc9-z5svs   1/1     Running   0          2d20h
All pods are running, with no restarts or changes since the issue started. Sweet - let’s check the logs.
❯ kubectl logs -n kube-system -l k8s-app=kube-dns --tail=100

.:53
[INFO] plugin/reload: Running configuration SHA512 = 591cf328cccc12bc490481273e738df59329c62c0b729d94e8b61db9961c2fa5f046dd37f1cf888b953814040d180f52594972691cd6ff41be96639138a43908
CoreDNS-1.11.3
linux/arm64, go1.21.11, a6338e9
.:53
[INFO] plugin/reload: Running configuration SHA512 = 591cf328cccc12bc490481273e738df59329c62c0b729d94e8b61db9961c2fa5f046dd37f1cf888b953814040d180f52594972691cd6ff41be96639138a43908
CoreDNS-1.11.3
linux/arm64, go1.21.11, a6338e9
The logs are empty, but at least there’s no errors!
Expanding the Search
If CoreDNS is healthy, it could be a general networking issue. We should quickly test from a fresh pod:
❯ kubectl run debug-dns --rm -it --image=busybox --restart=Never -- nslookup accounts.production.svc.cluster.local

Server:         10.96.0.10
Address:        10.96.0.10:53

Name:   accounts.production.svc.cluster.local
Address: 10.96.80.99

pod "debug-dns" deleted from production namespace
It works! DNS resolution is working, at least from a debug pod, but the error we’re seeing is definitely pointing to DNS timeouts.
Checking the Metrics
Perhaps it’s a capacity issue that only becomes apparent under load. Let’s look at the CoreDNS metrics:
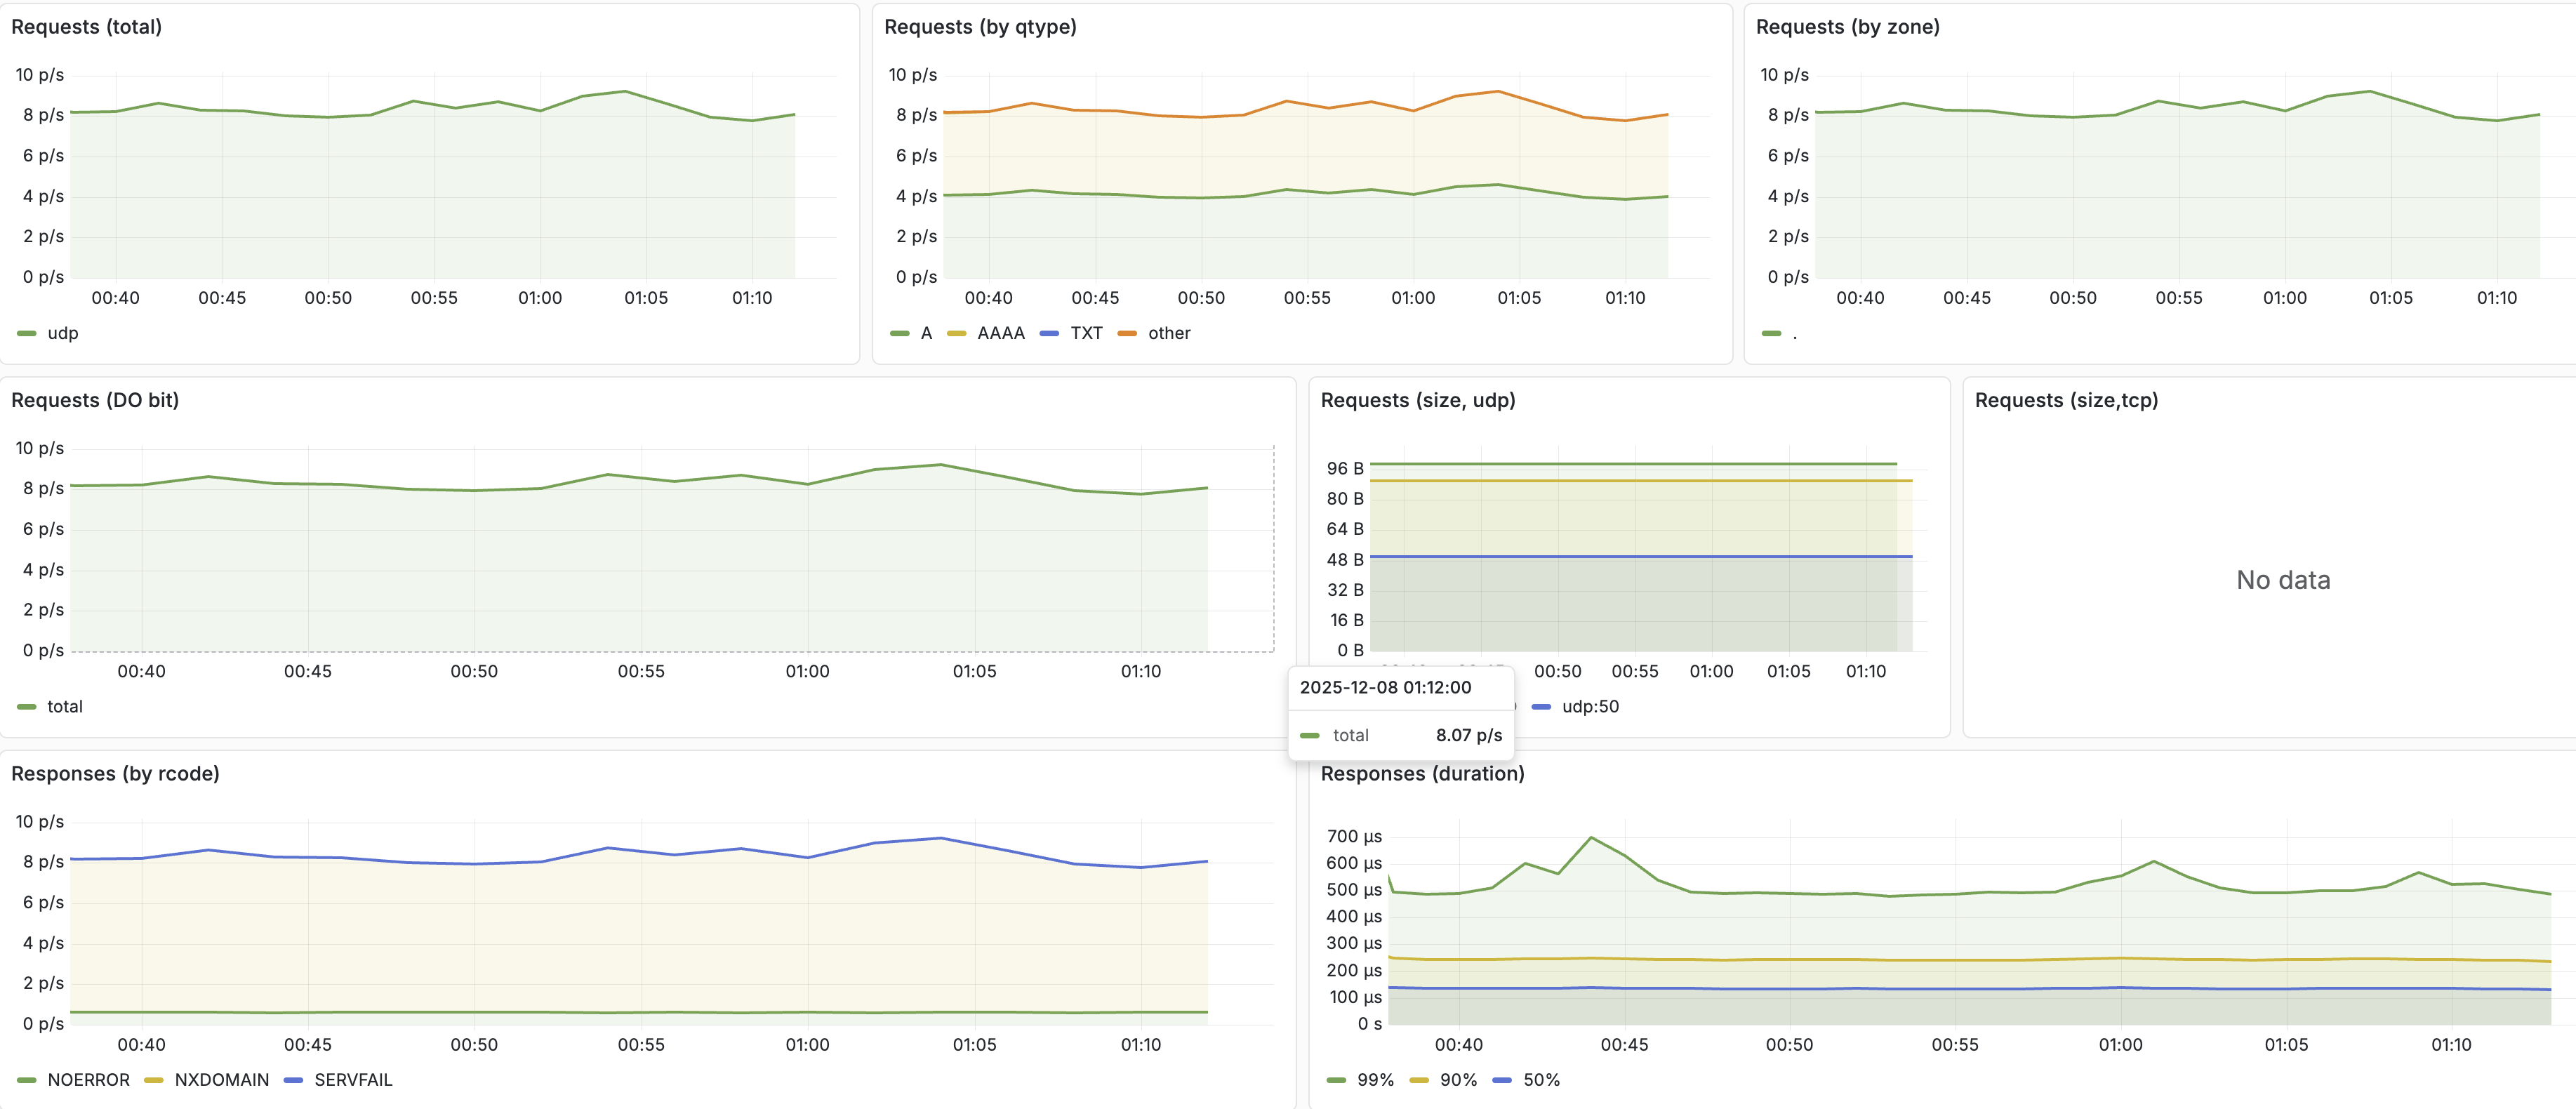
Everything seems normal, but just in case, let’s try scaling the coreDNS deployment:
❯ kubectl -n kube-system scale deployment coredns --replicas 3

deployment.apps/coredns scaled
After a few minutes, nothing has changed!
Let’s try with load
Everything indicates that DNS working fine, but the gateway is still failing. It could be due to the load on the DNS servers. To test the hypothesis, we load test the DNS servers:
kubectl run debug-dns --rm -it --image=busybox --restart=Never -- sh -c 'while true; do nslookup accounts.production.svc.cluster.local > /dev/null || (echo "failed" && break); done'This pod simply ran nslookup until DNS failed, except it didn’t fail.
The Dead End
At this point, we’ve spent the entire morning verifying that the DNS infrastructure is completely healthy. CoreDNS was working, the network was working, and other pods were resolving DNS without any issues. However, the gateway continued to throw EAI_AGAIN errors.
The error message said DNS was broken. Every check said DNS was fine. At this point, we’re certain that something has changed in the software itself; it’s time to throw this issue over the wall to the software team responsible for the gateway.
Part 2: The Developer Investigation
Getting a visit from the infrastructure guy is rarely good news. “DNS is broken for your app, but I’ve investigated DNS, and it’s working fine!” is particularly bad news, though.
Checking the deployment history
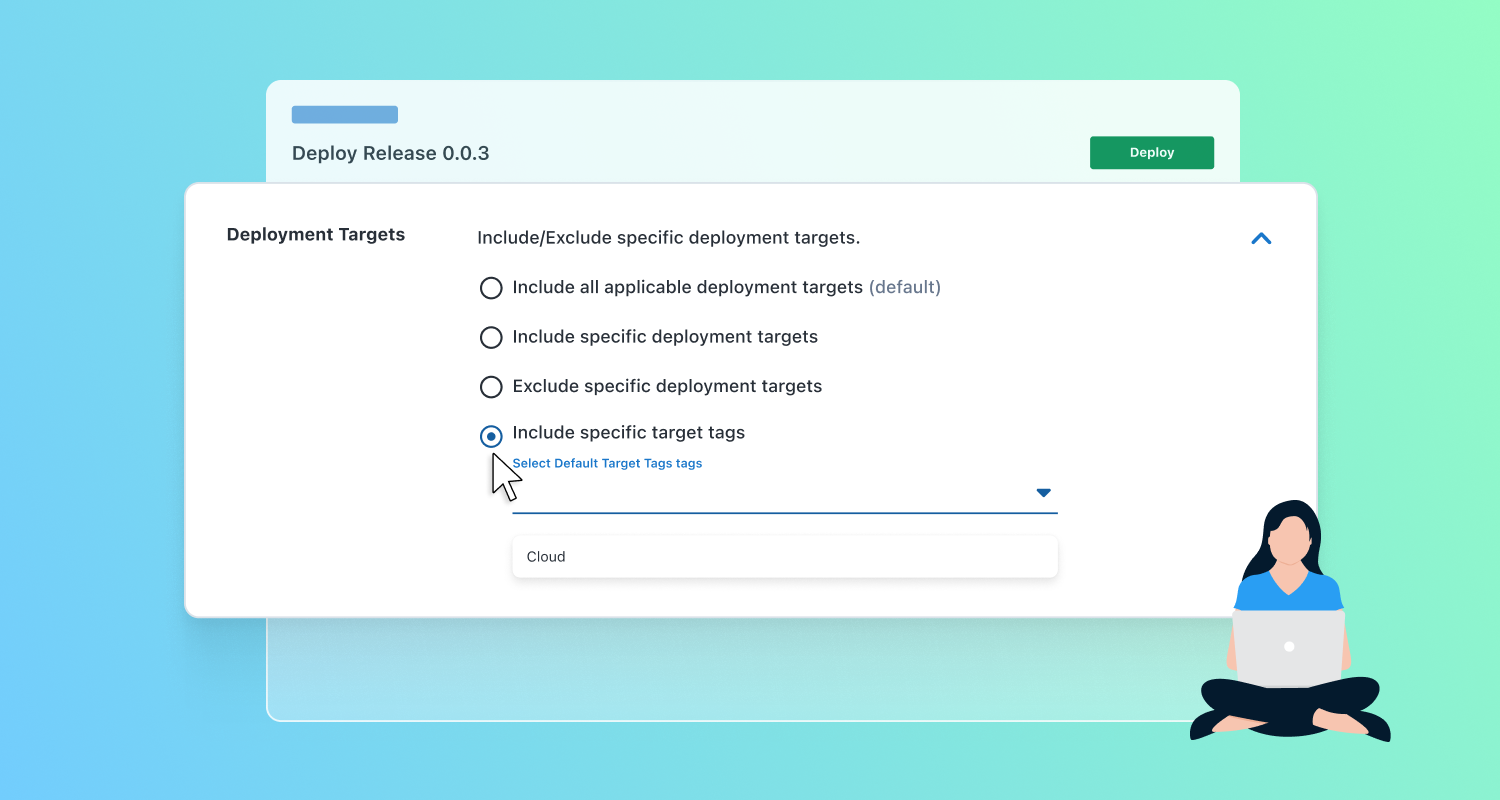
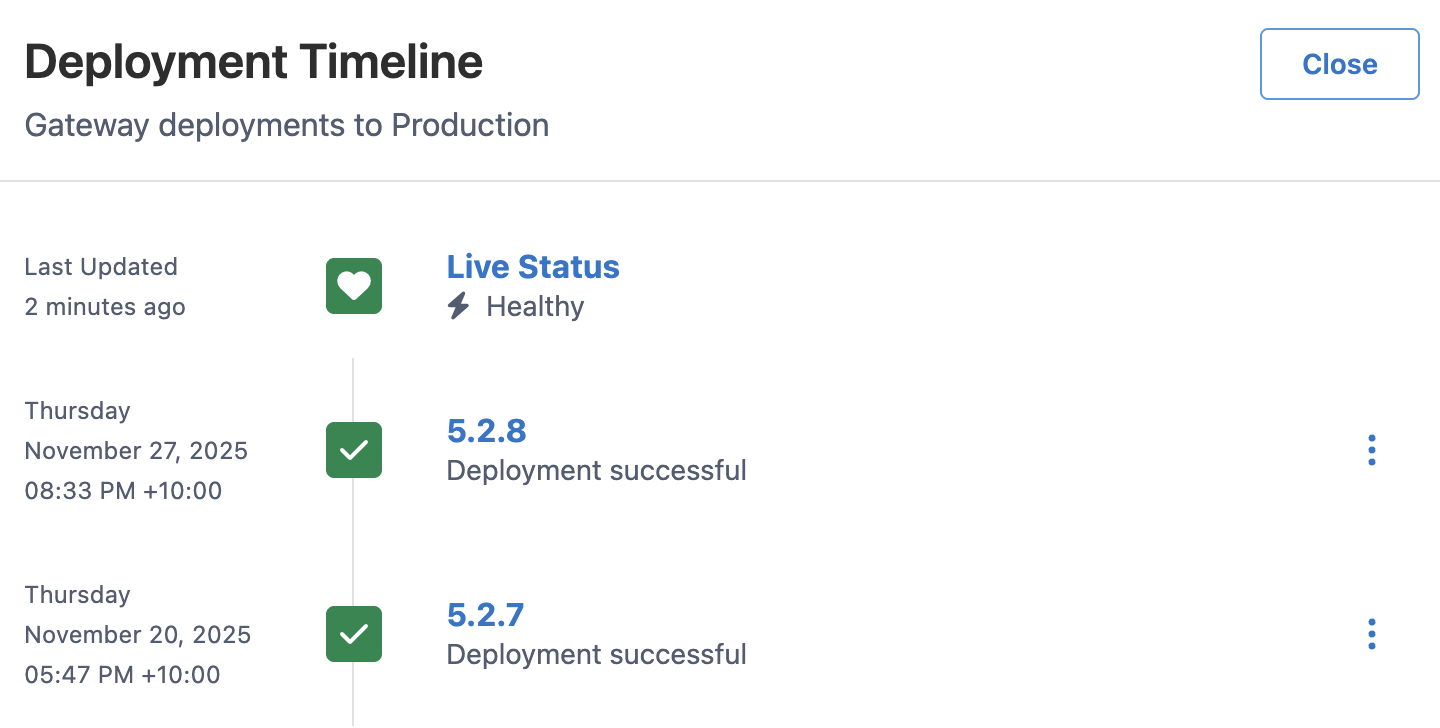
Since DNS is working fine for everything else in the cluster, something must have changed to trigger this issue - perhaps there was a recent deployment? We’ll check in Octopus Deploy to see whether there’s been any changes:
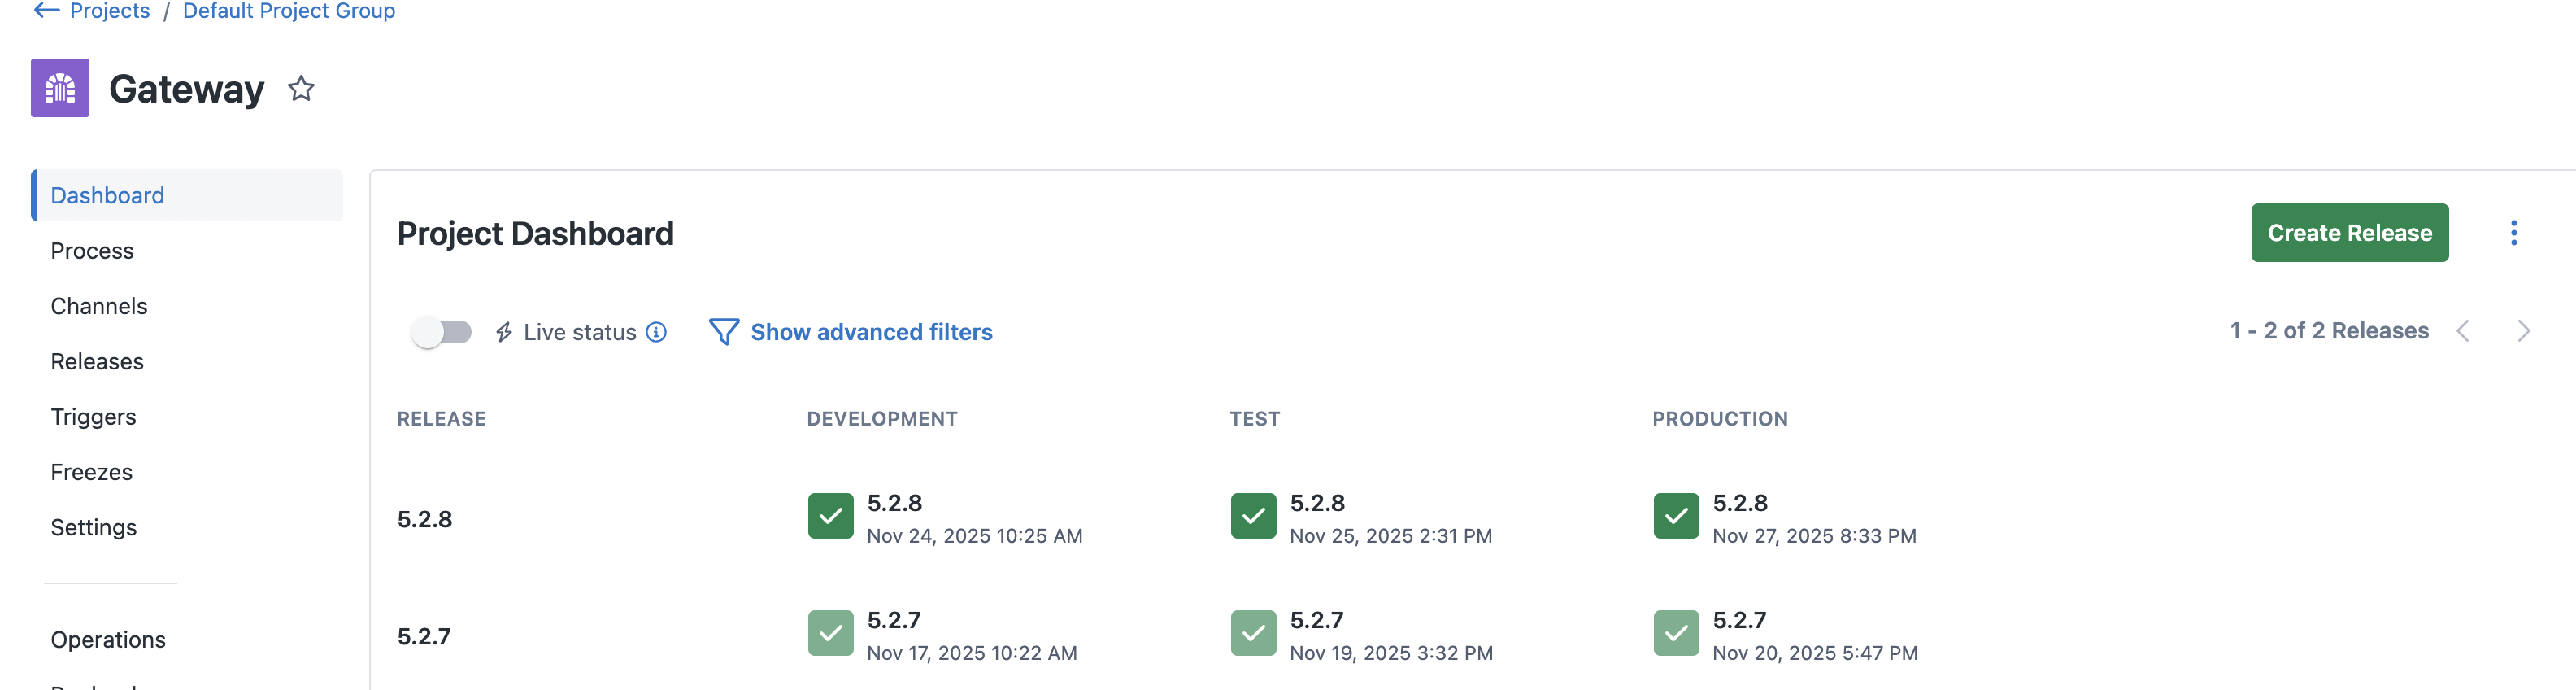
It looks like yesterday, your recent change made it through to production:
You’re familiar with this change - it’s a small performance optimization that adds a local cache. Instead of fetching and parsing schemas from backend services on every request, the gateway cached it to disk to look up when a request comes through. This shouldn’t impact DNS at all! Let’s verify the manifest that was deployed:
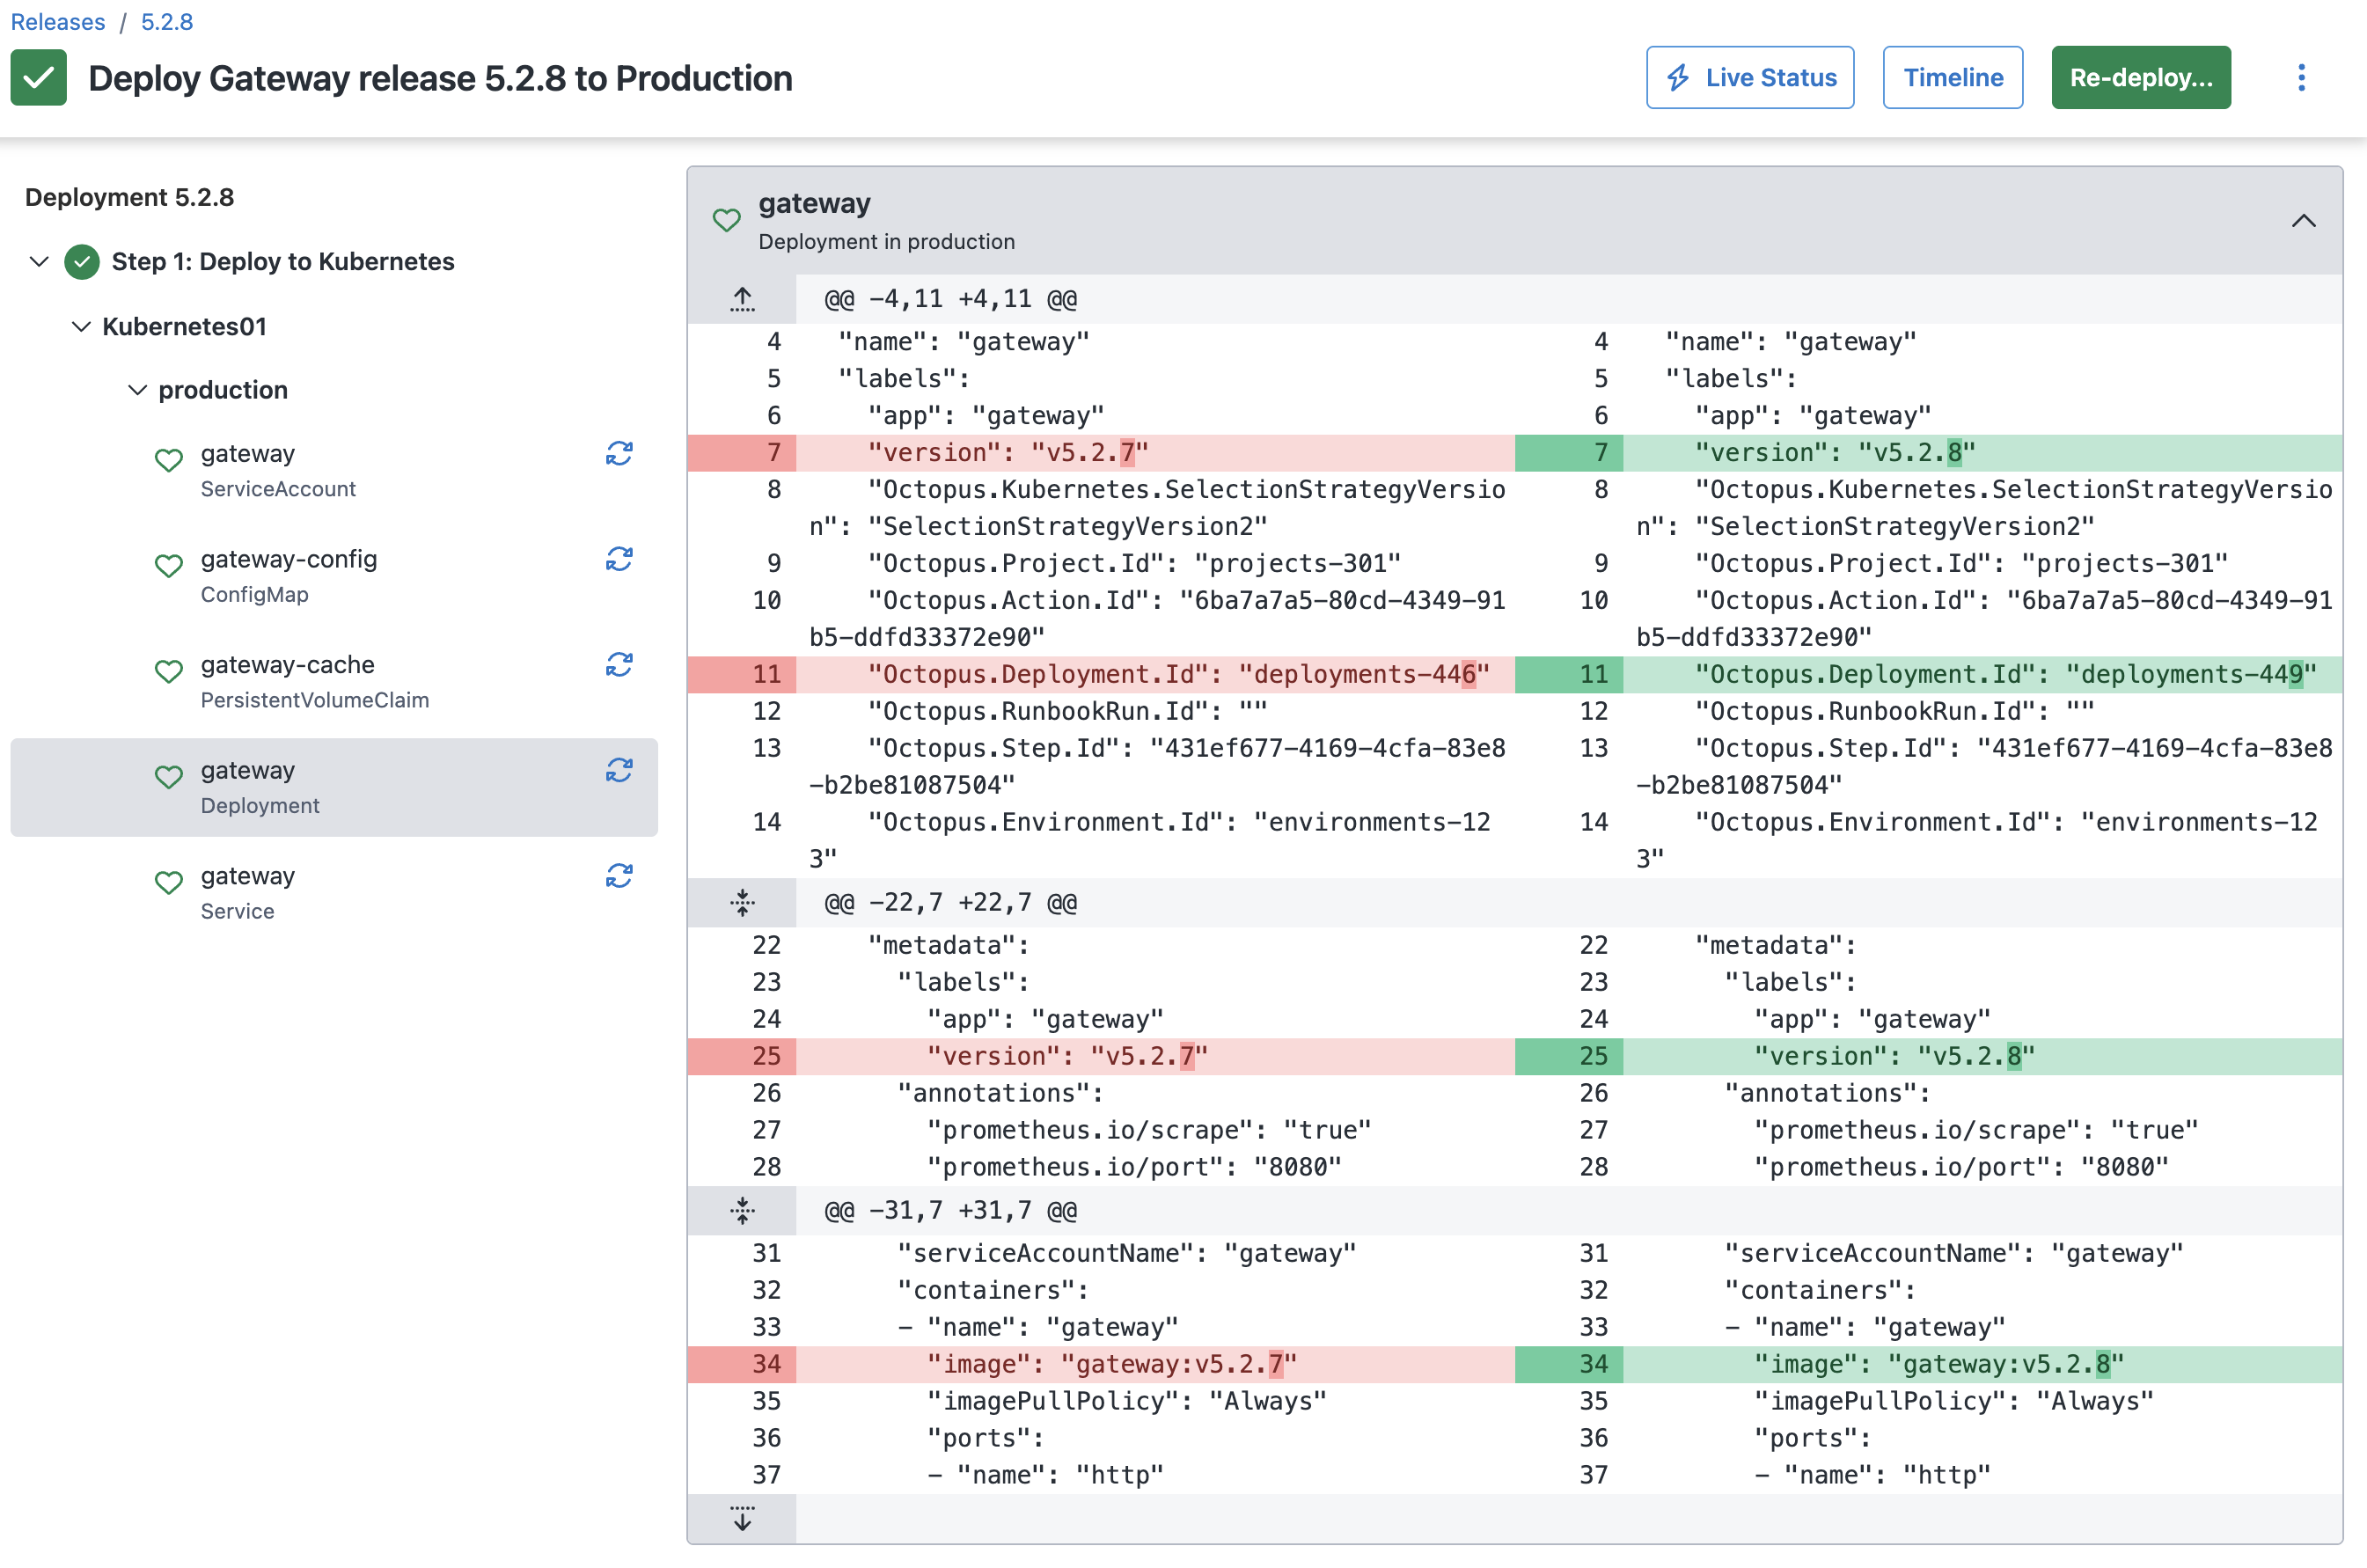
It’s only an image change - is it in sync in the cluster?
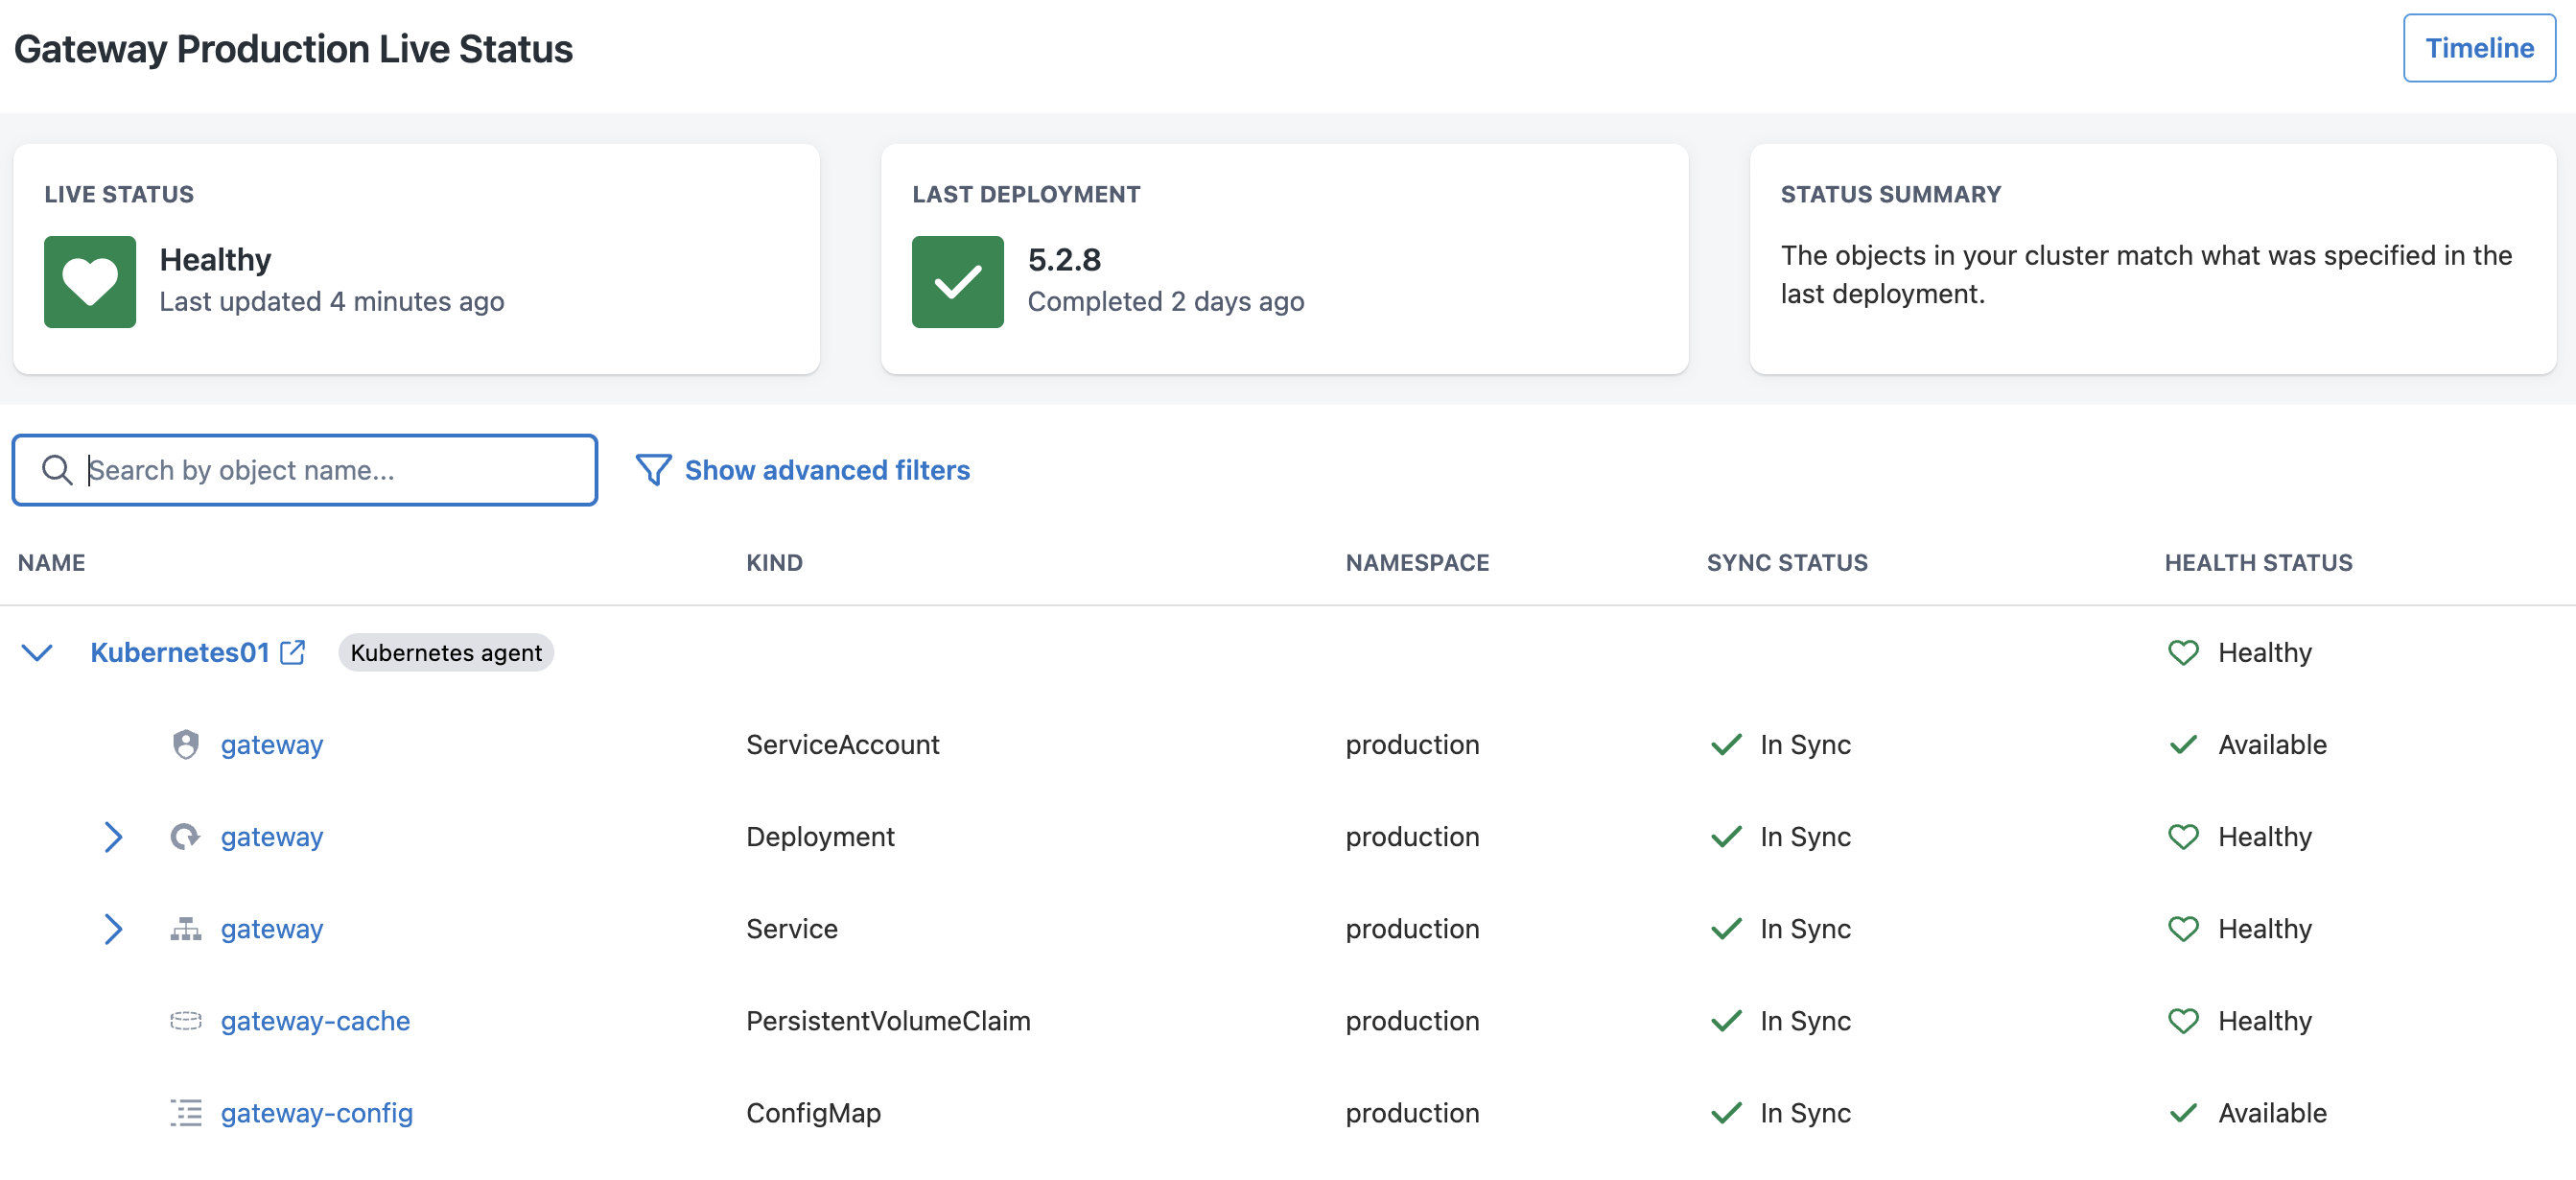
The resources all seem to be in sync, so they’re definitely unchanged.
Looking for patterns
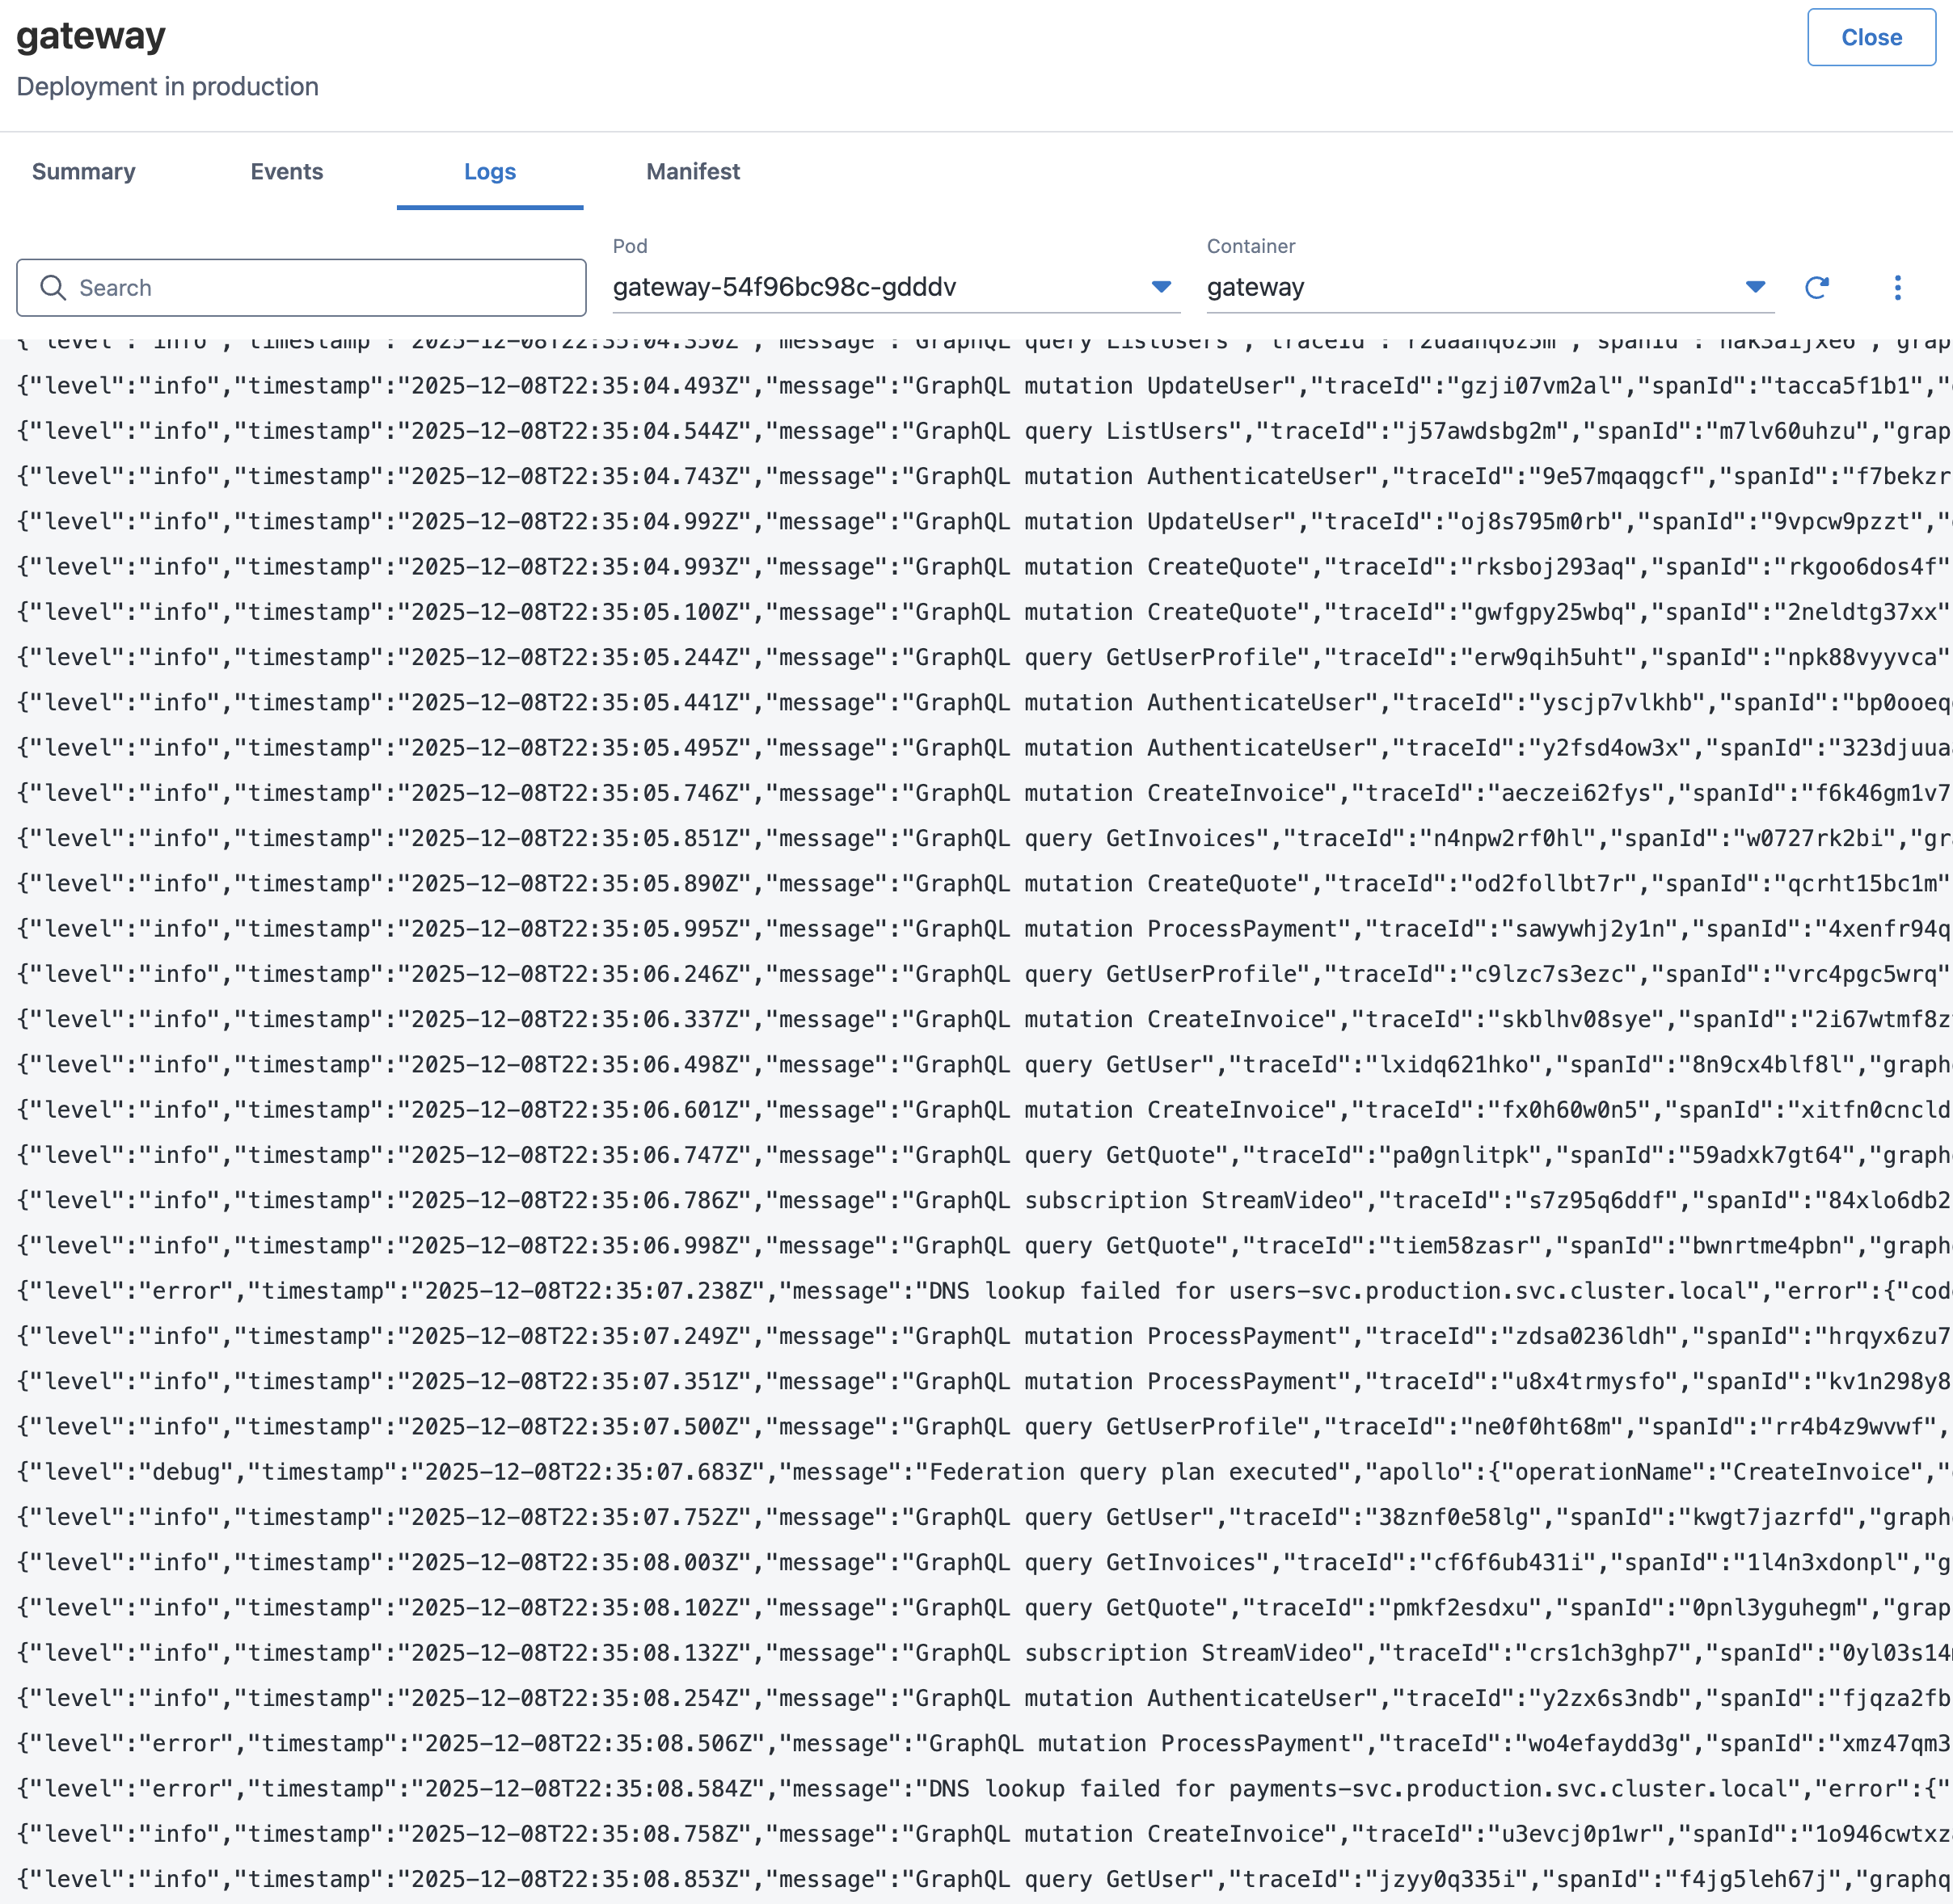 .
.
You can see the error logs with DNS issues in production, but when you examine your dev and test environments, none of them are showing the issue. In addition, you only see the DNS errors when there are lots of requests coming in at once. Maybe that’s why the issue isn’t showing up in the test environment!
Replication
To try and replicate the load of the production environment in the test environment, you boot up k6 and start generating GraphQL requests. As the load goes up, you wait to see DNS errors, but … nothing! All that happens is that the service slows down slightly, even at over 10 times the load that production is experiencing.
You’ve spent most of the afternoon trying to replicate the issue in the test environment, and still, nothing - it’s looking like we might need to start the complicated rollback process before the end of the day.
Part 3: Bridging the Gap
Before finishing up for the day, everyone catches up and discusses next steps. They go over the facts first:
- The errors received are definitely related to DNS
- No other pods are receiving DNS failures
- There doesn’t seem to be networking issues
- The DNS servers don’t seem to be having issues
- The DNS failures seem to start when there’s lots of load
- The same build of the software in test doesn’t have the problem, even when load tested
- The only change made was to add caching
This leads the infrastructure engineer down the path of the differences between environments:
- In test, there’s only 1 replica
- In production, there’s 3 replicas
- In test, the single replica uses an SSD volume
- In production, the replicas use a shared disk
Maybe this is somehow related to the shared disk?
Following the Thread
A search for DNS errors Node.js Kubernetes file locks turned up a Medium article, along with a suggestion to bump the UV_THREADPOOL_SIZE to help fix DNS resolution problems. After more research, it turns out that when a file is locked and you attempt to read it (even asynchronously), one of 4 threads (by default) will be taken up, waiting for the file call to be returned. One other job of these threads is DNS resolution!
The developer quickly made a change to move the cache to memory and re-hydrate on launch. The infrastructure engineer made a change to the UV_THREADPOOL_SIZE environment variable to help resolve the issue while the fix rolled out, and the problem began to ease immediately.
The post-mortem
During the incident post-mortem, we ended up writing up what went wrong:
- Schema cache writes files to a shared volume on one pod
- Schema is attempted to be read/written by another pod
- Under high traffic, these operations deadlock
- The cache operations saturate the threadpool while waiting on locks
dns.lookup()calls queue up waiting for a free thread- Queued DNS lookups eventually timeout
- Application logs:
EAI_AGAIN
In the end, even though the error was related to DNS, the actual problem was filesystem contention that only occurred when running in environments with multiple replicas.
Part 4: Looking to the future
Though finding this bug was painful for me at the time, it helped me to bring a new approach to troubleshooting failures, especially around distributed systems like Kubernetes with multiple layers of abstraction.
Involve developers early
Developers have the most context around what’s going on in their app - if something is going on, they’ll know the changes and usage patterns much more intimately than infrastructure teams. Ensure that developers have the necessary access to independently investigate.
Make sure deployment history is visible
When something breaks, “What changed?” should be the first question. Making it easy for both infrastructure and software teams to see the deployment history to environments is one of the best things you can do.
Document dependencies
Software tends to have the most problems in the seam between software and hardware - IO. When using networking, storage, or other IO, it’s worth documenting why and how you’re doing so. It helps infrastructure teams understand requirements, especially in distributed systems.
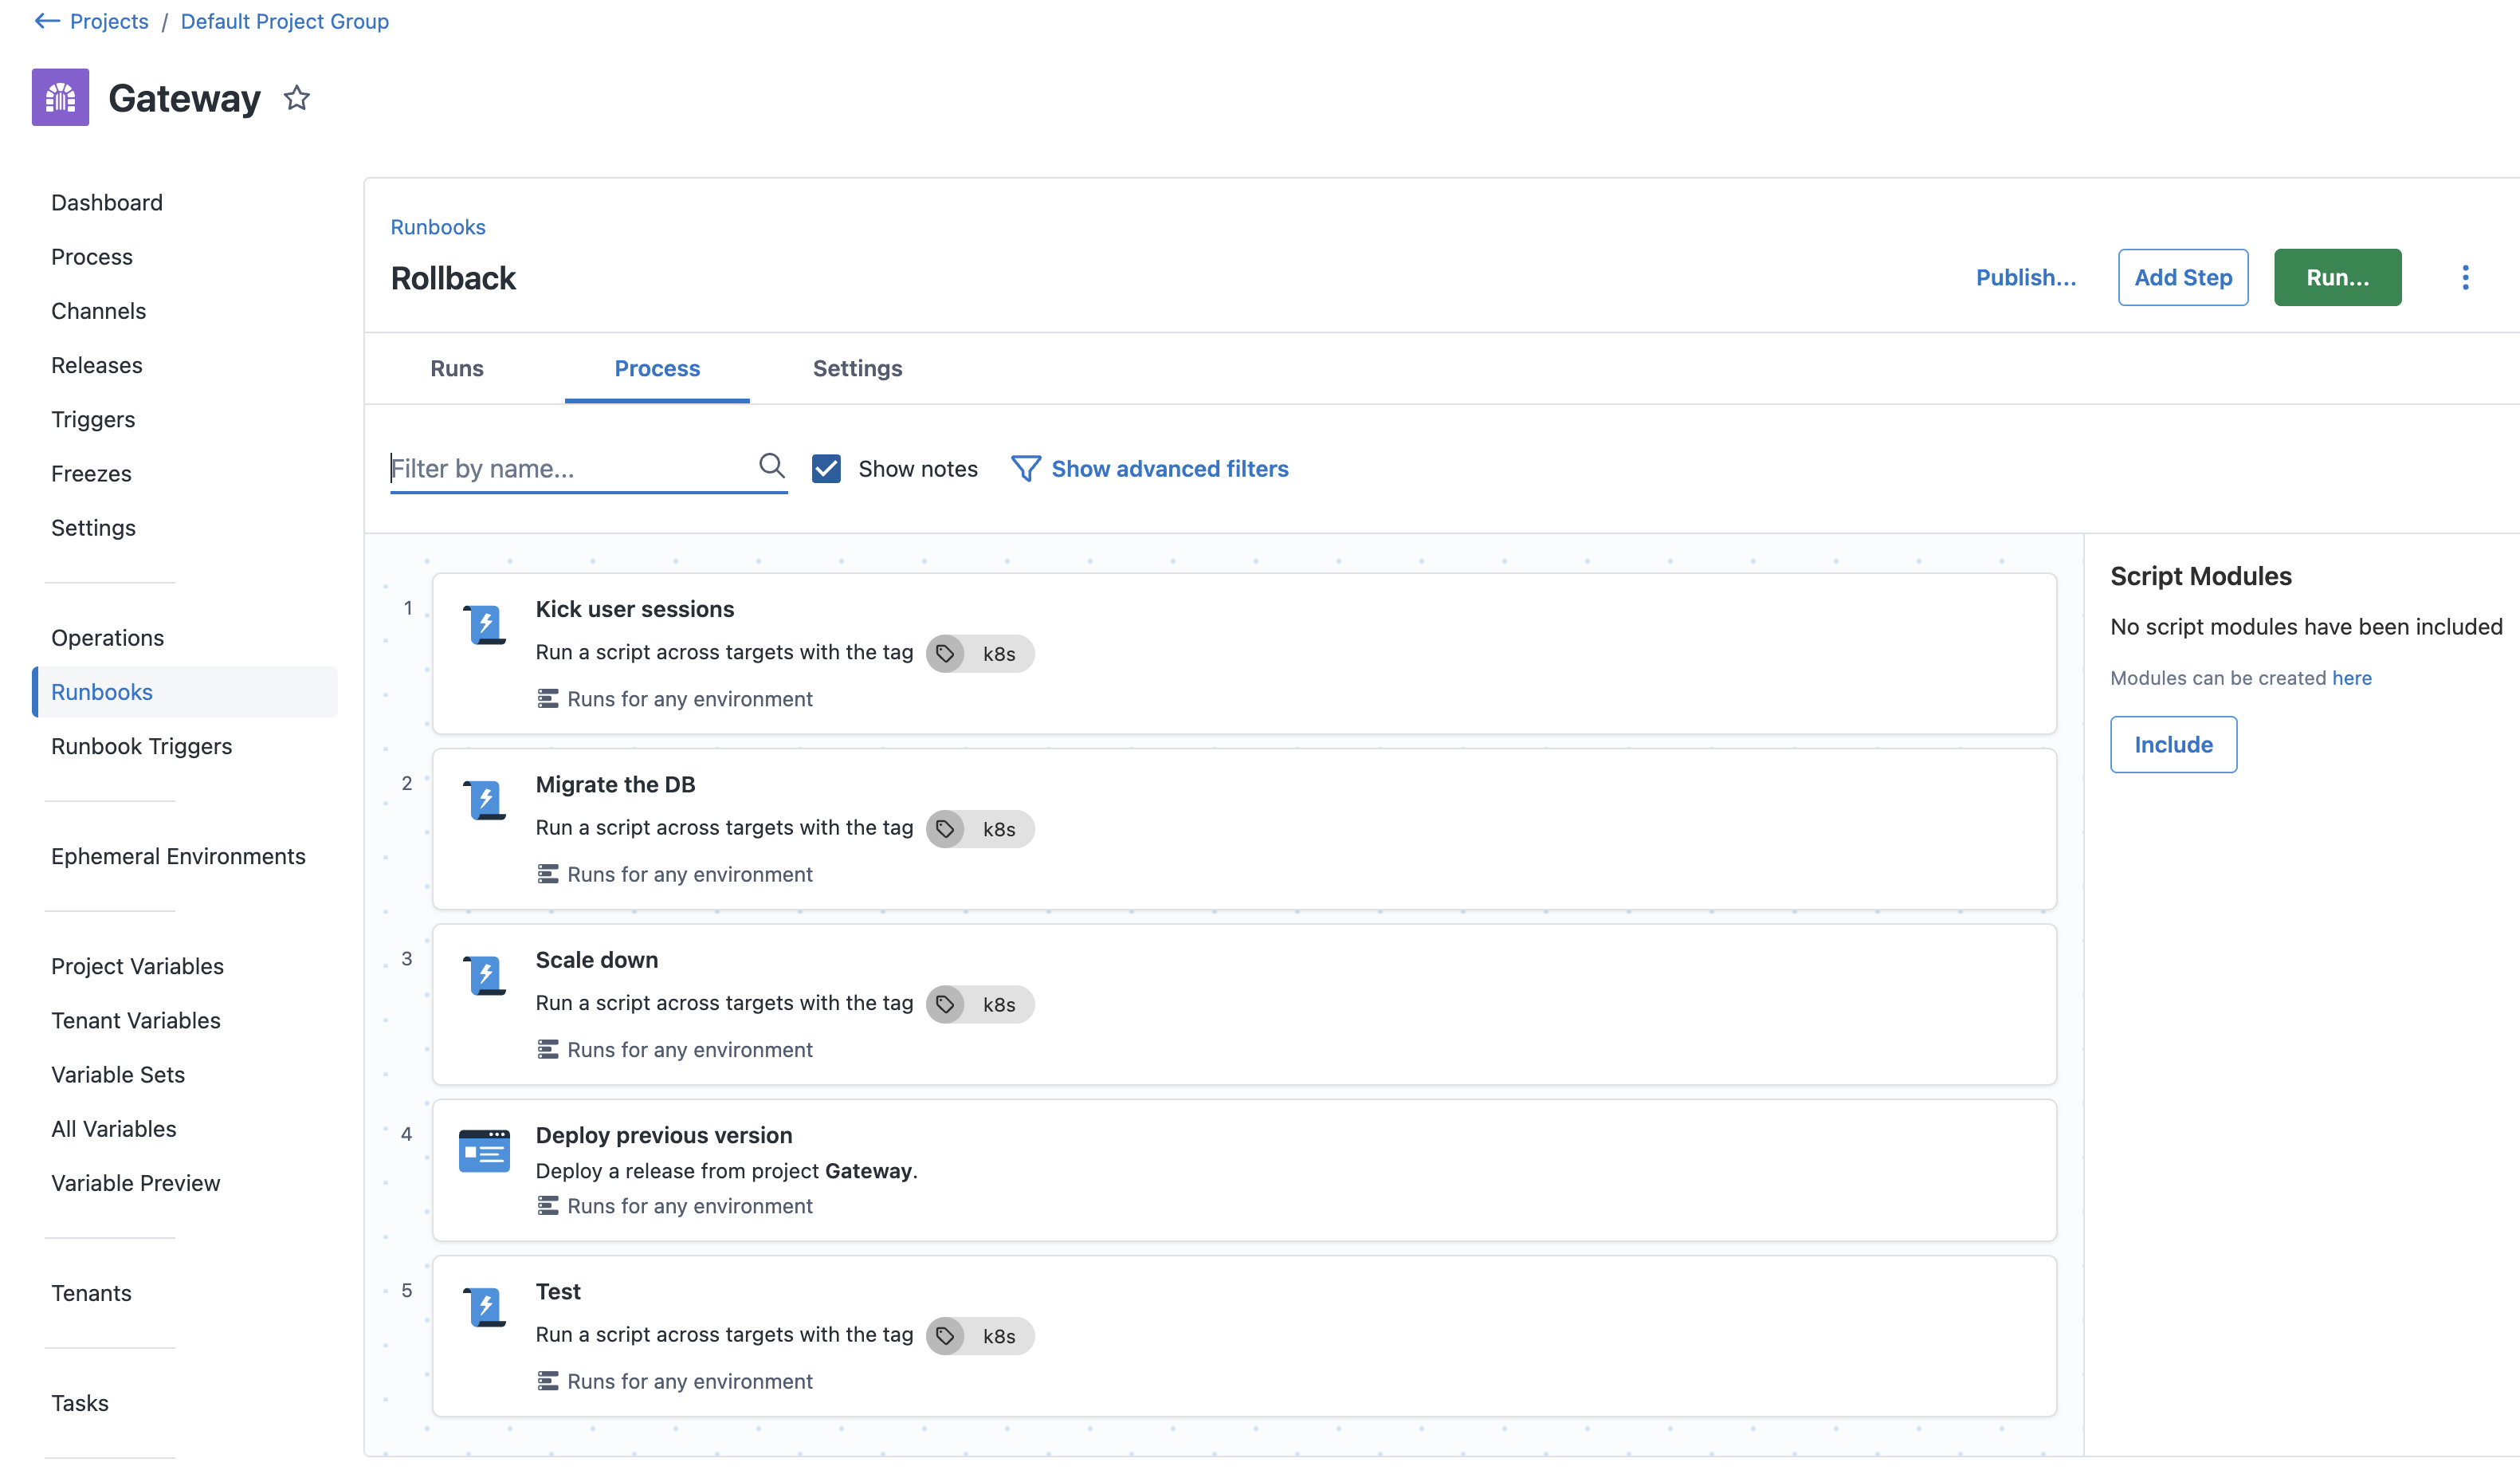
Automate rollbacks
A significant reason this bug affected people longer than we had hoped was due to the complicated and involved rollback process. One of the first things we did afterwards was create a runbook to automate the process of rolling back, so that we could mitigate the problem faster and buy time to investigate issues.
Conclusion
When you’re troubleshooting in Kubernetes, you’re troubleshooting a system that spans multiple layers of abstraction, multiple teams, and multiple mental models. No matter what tools or processes you use, when you’re trying to solve a problem, allowing as many people as possible to contribute their understanding of the systems involved is the most important thing to do.
The next time you’re debugging an incident and discover DNS caused it, I hope you’ll remember this story about one of the rare instances when it wasn’t. Remember the lessons we learnt, so if the next issue isn’t DNS, you’ll be able to dig deeper and solve the problem with way less stress than we did.
Tags: