What is NGINX web server and why should you deploy it on Kubernetes?
NGINX is a high-performance, open-source web server that also functions as a reverse proxy, load balancer, and HTTP cache. It is a widely adopted solution powering many of the world’s busiest websites and APIs.
Running NGINX inside a Kubernetes cluster extends its capabilities by using Kubernetes’ orchestration and service discovery features. This combination improves both scalability and manageability, especially in dynamic, container-based environments. Below are key benefits of deploying NGINX on Kubernetes:
- Service discovery and load balancing: Kubernetes automatically assigns DNS names to services, allowing NGINX to route traffic between pods without hardcoding IPs. This simplifies scaling and service replacement.
- Automated scaling: With Kubernetes’ Horizontal Pod Autoscaler, NGINX instances can scale up or down automatically based on traffic patterns or CPU usage, ensuring efficient resource use.
- Self-healing and high availability: Kubernetes restarts failed NGINX pods and reschedules them on healthy nodes. Combined with NGINX’s own ability to route around unhealthy upstreams, this results in resilient and highly available services.
- Simplified deployment and updates: Kubernetes enables declarative deployment of NGINX configurations using YAML manifests or Helm charts. Rolling updates and rollbacks help minimize downtime during changes.
- Configuration as code: NGINX configurations can be stored in ConfigMaps or mounted from volumes, making version control and environment-specific adjustments straightforward.
- Secure exposure of services: NGINX can be used as an ingress controller within Kubernetes to expose internal services securely to the outside world, often with built-in support for TLS termination and access control.
- Traffic control and observability: Integration with Kubernetes-native tools (e.g., Prometheus, Grafana) and support for advanced NGINX modules allows fine-grained traffic shaping, logging, and monitoring.
This is part of a series of articles about software deployment.
Quick tutorial: deploying NGINX on Kubernetes
This tutorial walks through the process of deploying NGINX in a Kubernetes cluster using a Deployment object. It covers how to create, update, scale, and delete the deployment using kubectl commands and YAML configuration files. Instructions are adapted from the Kubernetes documentation.
Step 1: create the NGINX deployment
Start by defining a deployment in a YAML file. This example creates two replicas of a pod running the nginx:1.14.2 container:
apiVersion: apps/v1
kind: Deployment
metadata:
  name: nginx-deployment
spec:
  replicas: 2
  selector:
    matchLabels:
      app: nginx
  template:
    metadata:
      labels:
        app: nginx
    spec:
      containers:
        - name: nginx
          image: nginx:1.14.2
          ports:
            - containerPort: 80
Apply the configuration to your cluster:
kubectl apply -f https://k8s.io/examples/application/deployment.yaml![]()
To view details about the deployment:
kubectl describe deployment nginx-deployment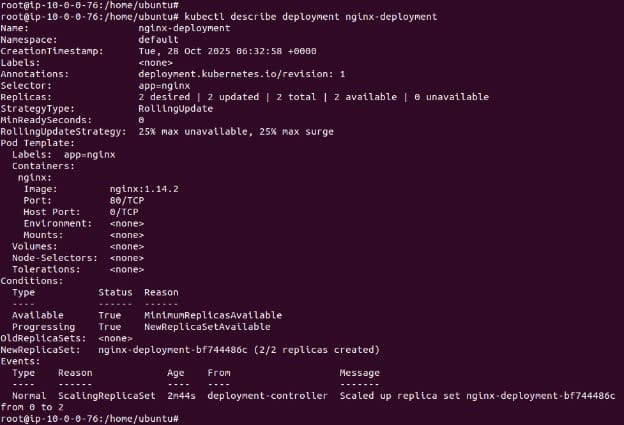
Step 2: inspect the running pods
Once the deployment is active, check the status of the created pods:
kubectl get pods -l app=nginx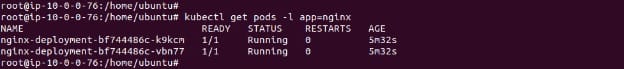
To inspect an individual pod:
kubectl describe pod <pod-name>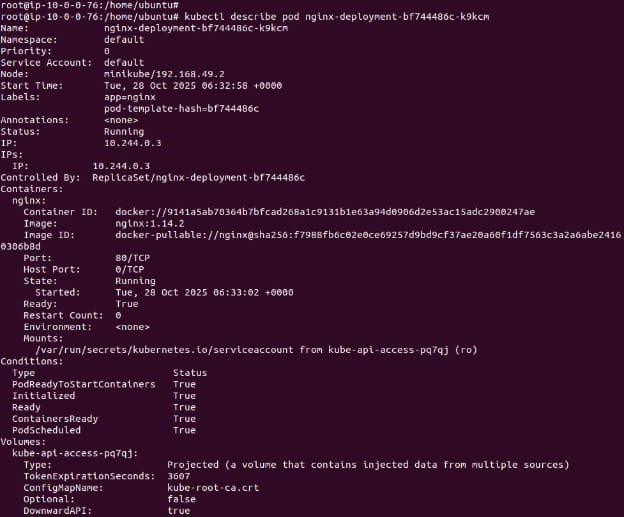
Replace <pod-name> with the actual name of a pod from the list.
Step 3: update the NGINX version
To update the NGINX container to a new version, modify the image in the deployment YAML, substituting the numbers after nginx: with the current version:
image: nginx:1.16.1Apply the updated configuration:
kubectl apply -f https://k8s.io/examples/application/deployment-update.yamlCheck that the new pods are running and the old ones are terminated:
kubectl get pods -l app=nginxStep 4: scale the deployment
To scale the number of replicas from 2 to 4, adjust the replicas field:
replicas: 4Apply the scaling configuration:
kubectl apply -f https://k8s.io/examples/application/deployment-scale.yaml![]()
Verify that four pods are running:
kubectl get pods -l app=nginx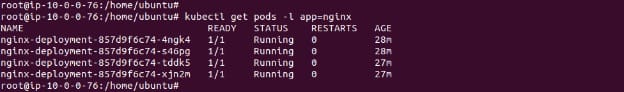
Step 5: delete the deployment
To remove the deployment and its associated pods:
kubectl delete deployment nginx-deployment![]()
This basic workflow demonstrates how to manage NGINX in Kubernetes using declarative configuration and kubectl. It forms the foundation for more advanced deployment patterns and automation.

Tony Kelly is a DevOps marketing leader who drives innovation and awareness of the latest trends in Continuous Delivery.
Best practices for deploying NGINX on Kubernetes
Here are some useful practices to keep in mind when working with NGINX on Kubernetes.
1. Use a Deployment with replicas, rolling updates, and Pod Disruption Budgets
Using a Deployment ensures NGINX pods are managed declaratively, with support for automated rollouts and rollbacks. This helps maintain service availability and consistency across versions. Specify at least two replicas in the spec.replicas field to ensure high availability, even during updates or pod restarts.
To control update behavior, use a rollingUpdate strategy. For example:
strategy:
  type: RollingUpdate
  rollingUpdate:
    maxSurge: 1
    maxUnavailable: 0
This ensures that one new pod is created at a time while keeping all old pods running, minimizing disruptions.
Also define a PodDisruptionBudget (PDB) to protect against too many pods being drained simultaneously:
apiVersion: policy/v1
kind: PodDisruptionBudget
metadata:
  name: nginx-pdb
spec:
  minAvailable: 1
  selector:
    matchLabels:
      app: nginx
This prevents voluntary disruptions (e.g., during node maintenance) from taking down all NGINX instances.
2. Pin the NGINX image and manage configuration explicitly
Always pin the NGINX Docker image to a specific, tested version (e.g., nginx:1.24.0). Avoid nginx:latest, which can silently introduce changes or vulnerabilities. Use image scanning tools (like Trivy or Grype) to validate images during CI/CD.
Manage the NGINX configuration via ConfigMaps. This allows separation of config from code, version control, and environment-specific overrides. For example:
apiVersion: v1
kind: ConfigMap
metadata:
  name: nginx-config
data:
  nginx.conf: |
    worker_processes 1;
    events { worker_connections 1024; }
    http {
      server {
        listen 80;
        location / {
          return 200 'NGINX is running';
        }
      }
    }
Mount this config into the container via a volume:
volumeMounts:
  - name: config-volume
    mountPath: /etc/nginx/nginx.conf
    subPath: nginx.conf
Optionally, use a sidecar like configmap-reload to watch for changes and trigger a graceful reload inside the NGINX process.
3. Expose via a Service appropriate to the use case with proper ports and security
Expose NGINX via a Kubernetes Service. Use ClusterIP for internal-only access, NodePort for direct external access, or LoadBalancer for managed cloud environments. Here’s an example using LoadBalancer:
apiVersion: v1
kind: Service
metadata:
  name: nginx-service
spec:
  type: LoadBalancer
  selector:
    app: nginx
  ports:
    - port: 80
      targetPort: 80
When exposing externally, use HTTPS and configure NGINX for TLS termination with ssl_certificate and ssl_certificate_key directives. Automate certificate management using cert-manager and Let’s Encrypt or your internal PKI.
Restrict access by applying NetworkPolicy rules or firewall rules at the infrastructure level. This limits which pods or IP ranges can reach your NGINX service.
4. Resource requests, limits, and proper scaling
Define resource requests and limits for CPU and memory to ensure NGINX gets scheduled on nodes with sufficient capacity and to avoid resource starvation. For example:
resources:
  requests:
    cpu: "200m"
    memory: "256Mi"
  limits:
    cpu: "500m"
    memory: "512Mi"
Requests ensure NGINX pods are scheduled properly, and limits prevent them from consuming too much.
Use the HorizontalPodAutoscaler (HPA) to scale NGINX based on traffic. Here’s a basic example using CPU usage:
apiVersion: autoscaling/v2
kind: HorizontalPodAutoscaler
metadata:
  name: nginx-hpa
spec:
  scaleTargetRef:
    apiVersion: apps/v1
    kind: Deployment
    name: nginx-deployment
  minReplicas: 2
  maxReplicas: 10
  metrics:
    - type: Resource
      resource:
        name: cpu
        target:
          type: Utilization
          averageUtilization: 60
For more advanced scenarios, use custom metrics (e.g., request rate or latency) with the Prometheus adapter.
5. Monitoring, logging, and health/performance observability
Enable access logs and error logs in your nginx.conf and route them to stdout/stderr. Kubernetes will capture them, and you can forward them to centralized logging systems like Fluent Bit, ELK, or Loki for analysis.
Add livenessProbe and readinessProbe to monitor the health of NGINX:
readinessProbe:
  httpGet:
    path: /
    port: 80
  initialDelaySeconds: 5
  periodSeconds: 10

livenessProbe:
  httpGet:
    path: /healthz
    port: 80
  initialDelaySeconds: 10
  periodSeconds: 30
Adjust the probes to avoid false positives, especially if you’re running in a service mesh where sidecar startup delays can interfere.
For metrics, use the NGINX Prometheus Exporter to expose request rate, connections, response codes, and more. Deploy it as a sidecar or separate pod, and scrape it with Prometheus. Visualize the data using Grafana dashboards to track latency, error rates, and performance bottlenecks.
Related content: Read our guide to Kubernetes deployment strategy
Help us continuously improve
Please let us know if you have any feedback about this page.