Getting started with CI/CD
To build a working Continuous Integration and Continuous Delivery (CI/CD) pipeline, you typically implement CI first, followed by CD. By building a solid CI foundation and adding CD, you ensure that your code is always tested and ready to deploy, and that deployments happen in a consistent, automated way.
Building a Continuous Integration (CI) pipeline typically involves
- Push code to version control: Start by hosting your code in a Git-based system like GitHub, GitLab, or Bitbucket. Every code push, branch creation, or pull request can trigger the CI process.
- Set up a CI tool: Choose a CI platform such as GitHub Actions, Jenkins, or CircleCI. Create a configuration file in your repo that defines how CI should run.
- Install dependencies and build the app: In your CI configuration, add steps to install libraries or dependencies, then build the application.
- Run automated tests: Add steps to run unit, integration, or smoke tests. CI tools typically fail the pipeline if any tests fail, preventing broken code from advancing.
- Report results: Configure your CI tool to notify developers when a build fails. This can include status checks in pull requests, email alerts, or messages in team chat tools.
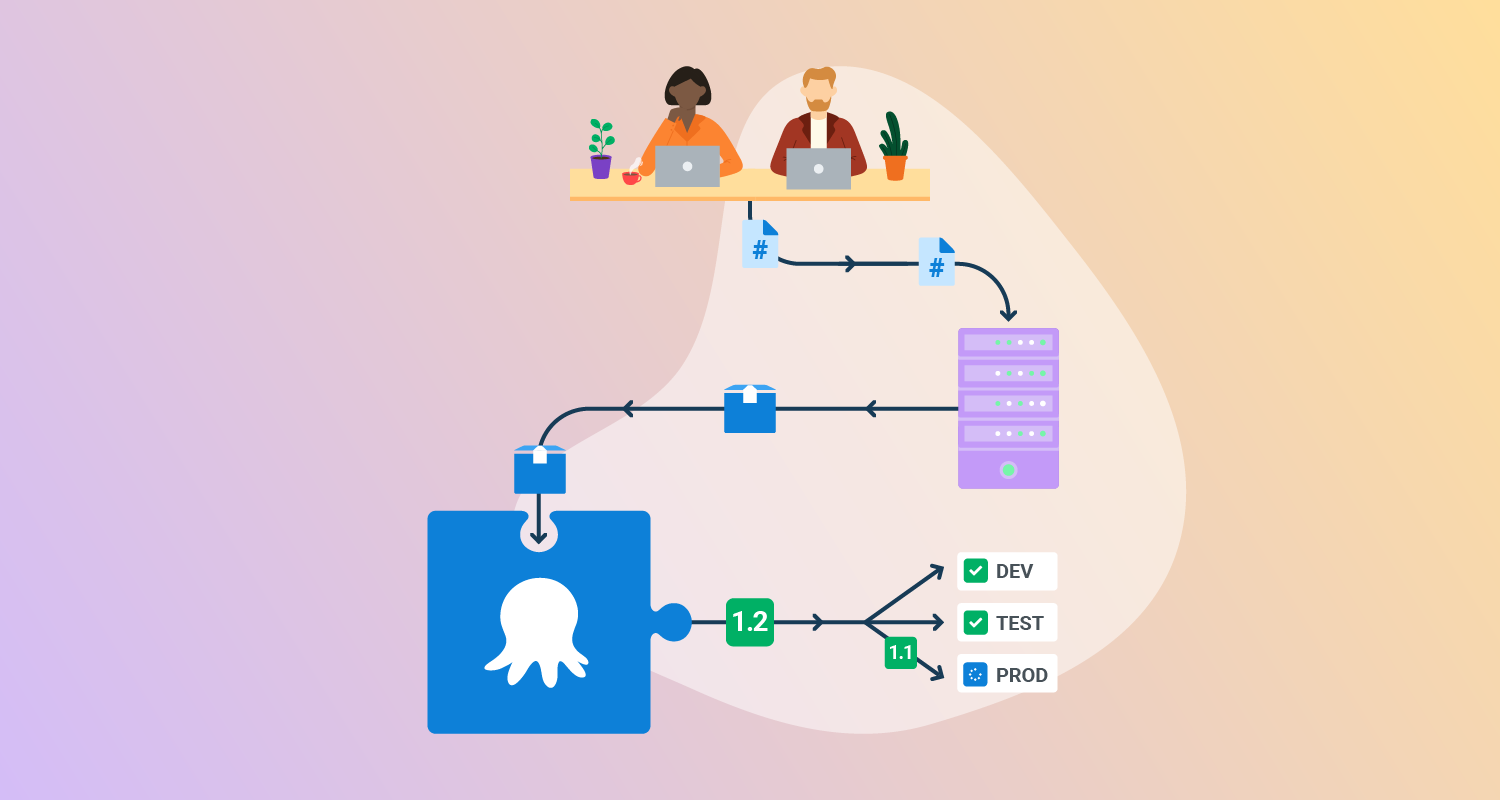
Building a Continuous Delivery (CD) pipeline typically involves
- Package your application: Once tests pass, package the application for deployment. This might include generating a Docker image, ZIP file, or publishing to an artifact repository like GitHub Packages or Docker Hub.
- Define the deployment process: Use a CD tool such as Octopus Deploy or Argo CD to define how your app should be deployed. Include steps like “Deploy to staging” or “Run database migration.”
- Manage configuration and secrets: Store environment-specific values (e.g., API keys, connection strings) in your CD tool’s variable system or secret store. Don’t hardcode them into your source code.
- Deploy to target environments: Deploy the packaged application to development, staging, or production environments. This can be done using shell scripts, Kubernetes manifests, Terraform, or Helm charts.
- Add monitoring and rollback options: Integrate monitoring tools to track performance and errors after deployment. Include rollback steps or strategies (e.g., blue/green deployments) to handle failures.
Further in this article we show a full tutorial for building your CI pipeline with GitHub Actions and your CD process with Octopus Deploy.
Key considerations for building your first CI/CD pipeline
When setting up your first pipeline, it’s easy to focus only on getting builds and deployments running. However, overlooking certain design aspects can create bottlenecks or failures later. The following points help ensure your pipeline is maintainable, scalable, and reliable from the start:
- Start simple, then evolve: Begin with a minimal pipeline; build, test, deploy to one environment, and expand gradually. Adding complexity too early makes debugging harder and slows adoption.
- Keep pipelines fast: A pipeline that takes too long discourages frequent commits. Use caching, parallel jobs, and optimized test suites to keep feedback loops under 10 minutes where possible.
- Use consistent environments: Build, test, and deployment environments should be as close to production as possible. Use containers or infrastructure-as-code to reduce environment drift.
- Separate build and deploy stages: Artifacts built during CI should be reused in CD without rebuilding. This ensures what you tested is exactly what you deploy.
- Secure the pipeline: Protect secrets with a managed store, enforce least-privilege permissions for pipeline agents, and verify dependencies with signature or checksum validation.
- Design for rollbacks: Assume deployments can fail. Plan rollback or redeployment steps in your pipeline, and test them as thoroughly as forward deployments.
- Monitor pipeline health: Track metrics like build duration, success rate, and deployment frequency. Visibility into pipeline performance helps detect issues and supports continuous improvement.
Learn more in our detailed guide to CI/CD pipeline
Tutorial: Building your first CI/CD pipeline
In this part of the article, we’ll walk through two hands-on tutorials:
- Continuous Integration with GitHub Actions: You’ll learn how to create a workflow that runs automatically on every code push, validates changes, and provides feedback directly in GitHub.
- Continuous Delivery with Octopus Deploy: You’ll learn how to package your application, define deployment steps, manage configuration, and automate releases across environments.
Continuous Integration with GitHub Actions
In this tutorial, you will set up a Continuous Integration (CI) pipeline using GitHub Actions. You’ll learn how to create a workflow file, trigger builds on code changes, run automated steps, and review results in GitHub. By the end, you will have a working CI pipeline that validates every commit and pull request automatically.
Step 1: Create a workflow file
Inside your repository, create a new file in the .github/workflows directory. Name it github-actions-demo.yml. If the directory doesn’t exist, create it along with the file. GitHub only detects workflows stored in this location, and the file must use .yml or .yaml as its extension.
Step 2: Define the workflow
Copy the following YAML into the file:
name: GitHub Actions Demo
run-name: ${{ github.actor }} is testing out GitHub Actions
on: [push]
jobs:
  Explore-GitHub-Actions:
    runs-on: ubuntu-latest
    steps:
      - run: echo "The job was automatically triggered by a ${{ github.event_name }} event."
      - run: echo "This job is now running on a ${{ runner.os }} server hosted by GitHub!"
      - run: echo "The name of your branch is ${{ github.ref }} and your repository is ${{ github.repository }}."
      - name: Check out repository code
        uses: actions/checkout@v5
      - run: echo "The ${{ github.repository }} repository has been cloned to the runner."
      - run: echo "The workflow is now ready to test your code on the runner."
      - name: List files in the repository
        run: |
          ls ${{ github.workspace }}
      - run: echo "This job's status is ${{ job.status }}."
This workflow triggers on every push. It runs on a GitHub-hosted Ubuntu runner, checks out your code, prints details about the run, and lists the repository contents.
Step 3: Commit the workflow
Commit the new file to your repository. You can commit directly to the default branch or create a new branch and open a pull request. Either way, pushing the workflow file triggers the workflow automatically.
Step 4: View workflow runs
Go to the Actions tab in your repository. Select the workflow run to see logs for each step. Expand any step to review its details, such as the repository files listed in the example above.
Step 5: Extend the workflow
At this stage, the workflow only prints messages and checks out code. You can extend it to run your project’s build and test steps. GitHub recommends workflows based on your repository’s language: for example, Node.js or Python test templates. You can use these templates as-is or customize them.
With this setup, every commit is automatically validated. If tests pass, your code is ready for review or merge. If something fails, the logs help identify which step broke. This shortens debugging time and keeps your main branch stable.
Continuous Delivery with Octopus Deploy
Octopus Deploy lets you automate the release of your software to different environments in a consistent, repeatable way. This tutorial walks you through the basics of setting up a Continuous Delivery (CD) workflow using Octopus, including creating a deployment process, managing variables, and deploying with Helm.
1. Package your application
Before you can deploy, you need to package your application. Octopus supports a variety of package formats such as ZIP, NuGet, and Docker images. You can store packages in the built-in Octopus repository or use external feeds like Docker Hub or GitHub Container Registry.
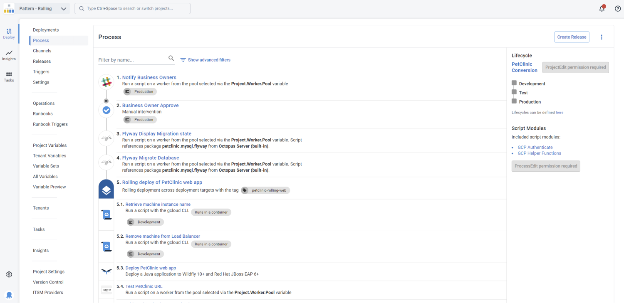
2. Define your deployment process
Go to your Octopus project and click Process to define your deployment steps. Each step represents a task such as deploying a package, running a script, or updating a Kubernetes cluster.
You can:
- Use built-in step templates (e.g., “Deploy a Package”, “Run a Script”, or “Deploy Helm Chart”)
- Reorder steps, set conditions (like which environments to run in), and configure retries
- Run steps in parallel or in sequence
For example, to deploy to Kubernetes using Helm, add the Deploy a Helm Chart step.
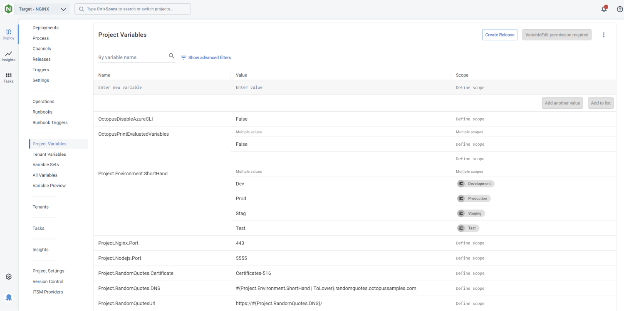
3. Add and use variables
Octopus variables let you customize deployments without changing your project configuration. Go to Variables in your project and add values like connection strings, environment-specific settings, or secrets.
Variables can be scoped by:
- Environment (e.g., dev, test, prod)
- Deployment target
- Step
- Channel
In your deployment steps or Helm values files, reference variables using syntax like:
image:
  repository: #{Octopus.Action.Package[nginx].PackageId}
  tag: #{Octopus.Action.Package[nginx].PackageVersion}
Octopus will substitute these values during deployment.
4. Create a release
Click Releases in your project and create a new release. A release captures a snapshot of your deployment process, variables, and packages at that point in time.
This ensures consistency; if you redeploy the same release, Octopus uses the exact same configuration.
5. Deploy to an environment
After creating a release, deploy it to an environment such as Development or Production. Octopus will execute your deployment process step by step.
If something fails, you can enable Guided Failure Mode, which pauses the deployment and lets you retry, skip, or cancel failed steps.
6. Automate with lifecycles and triggers
To fully automate CD:
- Define a Lifecycle that controls how a release moves through environments (e.g., dev → test → prod)
- Add a Trigger to automatically deploy when new packages are pushed or when releases are created
This enables hands-free deployments across your pipeline.
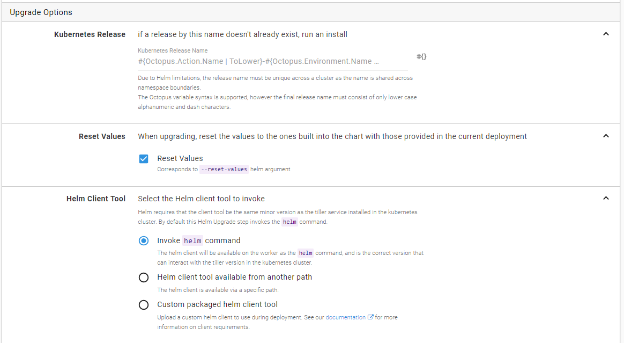
7. Deploy to Kubernetes with Helm (optional)
If you’re deploying to Kubernetes:
- Add a Deploy a Helm Chart step
- Choose your chart source (Helm feed, OCI registry, or Git repository)
- Provide values via:
- Inline YAML
- Files in your Git repo or package
- Key/value pairs using variables
Octopus will run the helm upgrade --install command using the chart and values you define. You can also use --reset-values to override old config completely.
CI/CD best practices for beginners
Here are some useful practices to consider when learning to implement Continuous Integration and Continuous Delivery/Deployment.
1. Store all code, configs, scripts, dependencies in version control
To make builds reproducible and deployments consistent, all project-related assets should live in version control. This includes:
- Application code
- Build and deployment scripts
- Environment configuration files (e.g., .env, YAML, JSON)
- Infrastructure-as-code templates (e.g., Terraform, CloudFormation, Helm)
- Database migration scripts
- Test data and test configuration files
Use Git to track these assets, and structure the repository so each part of the pipeline knows where to find what it needs. For example, store deployment scripts in a /deploy folder, tests in a /tests directory, and infrastructure files in /infra.
Avoid hardcoding sensitive data. Instead, reference them using environment variables or pull them from secure storage. Commit only encrypted versions if secrets must be versioned. With everything in one place, it becomes much easier to recreate past builds, audit changes, and onboard new developers.
2. Test in realistic environments
Automated tests are only reliable if they run in environments that mimic production. Differences in OS, configuration, or software versions can cause tests to pass in CI but fail after deployment.
To align test environments with production:
- Use containers (e.g., Docker) to ensure environment parity
- Match service versions (e.g., databases, message brokers)
- Reuse the same deployment templates (e.g., Helm charts, Terraform modules)
- Simulate traffic and user behavior in staging environments
- Ensure configuration files (e.g., feature flags, environment variables) reflect production setups
Tools like Docker Compose or Kubernetes (via Minikube or Kind) allow spinning up realistic environments locally or in CI. Also consider using feature environments (short-lived, per-branch deployments) for full-stack validation before merging.
3. Make CI/CD feedback visible
Fast feedback loops are critical to maintaining velocity and confidence. Developers should know immediately when a build or deployment fails, and why.
Make feedback visible by:
- Posting CI status to team channels (e.g., Slack, Microsoft Teams)
- Showing build badges in project documentation
- Sending emails or creating GitHub issues for failed builds
- Displaying dashboards that track build durations, failure rates, and deployment frequency
- Tagging developers in failed pipeline runs for faster triage
CI/CD systems like GitHub Actions, GitLab CI, and CircleCI offer rich integration options. Use these to pipe results into the tools your team already uses. Include actionable data, such as logs, failed test names, or metrics, to help resolve issues quickly.
4. Incorporate security scans and compliance checks early
Security and compliance should be baked into your CI/CD pipeline, not added later. By integrating scans early, you catch issues while they’re still cheap to fix.
Add security and compliance stages that run:
- Static code analysis (SAST) for vulnerabilities in your codebase
- Software composition analysis (SCA) for third-party library risks
- Container scanning for image vulnerabilities (e.g., using Trivy or Grype)
- Infrastructure configuration checks (e.g., using Checkov or tfsec)
- License compliance validation (e.g., OSS Review Toolkit)
You can block builds on critical vulnerabilities or generate reports for manual review. Adopt the principle of least privilege in deployment steps, and rotate secrets regularly. For regulated environments, integrate tools that produce audit-ready artifacts showing compliance with standards like SOC 2, HIPAA, or ISO 27001.
5. Use AI-assisted automation
AI and machine learning tools can improve CI/CD efficiency and quality in several ways. For example:
- Test optimization: AI can predict which tests to run based on recent changes, speeding up feedback
- Anomaly detection: Machine learning can identify unusual build or deployment patterns
- Root cause analysis: Natural language processing tools can summarize logs and suggest fixes
- Code quality suggestions: AI-driven code reviewers like GitHub Copilot or CodeWhisperer can flag anti-patterns and security issues before code reaches CI
- Failure prediction: Some platforms analyze historical build data to predict and prevent future failures
These tools don’t replace developers but augment them by reducing noise, prioritizing risks, and automating repetitive tasks. As part of CI/CD, AI helps simplify testing, improve reliability, and scale delivery across teams.
Related content: Read our guide to CI/CD best practices
Help us continuously improve
Please let us know if you have any feedback about this page.