If you are experiencing a problem with the memory consumption of your Octopus installation we may ask you to record some memory snapshots and send them through to us for analysis.
Memory analysis is most successful when you can provide us with a full picture of the problem at hand:
- Recording of server metrics like CPU, RAM, Disk I/O and any other metrics which may be useful
- Detailed Octopus logs.
- The exported dotMemory Workspace (containing the snapshots you’ve recorded).
Privacy
We use JetBrains dotMemory to record and analyze the memory snapshots. We are only concerned with memory allocations, whether there is a memory leak, and which functions allocated the memory. To protect your privacy we will provide you with a secure location to upload the snapshots and any supporting data, only use the data you provide for the memory analysis, and then delete everything once the analysis has been completed.
Getting prepared
- Start recording CPU, RAM and Disk I/O using performance monitor (or similar).
Recording the memory snapshots
We usually only need one or two snapshots, the most important thing is that the snapshots cover the period of time where the problem occurs. This may be during a particular deployment, or when another Octopus task is running (like retention policy processing or health checks), or perhaps it’s just happening throughout the day.
If we haven’t asked for anything specific, start by taking a single snapshot of your running Octopus Server so we can analyze it and go from there.
Get a snapshot from your running Octopus Server
This is the best way to start, especially if you cannot restart your Octopus Server, or if the memory problem takes a long time to occur or is difficult to reproduce. It requires a small standalone executable called dotmemory.exe which will take snapshots of your running Octopus Server.
- Download the dotMemory command-line tool and extract it to a location on the Octopus Server like
C:\tools\dotmemory.exe. - Open a command prompt as an Administrator (elevation is required).
- Run:
dotmemory.exe get-snapshot Octopus.Server. - Take note of the location where the dotMemory workspace file was saved (you’ll need this later).
- Use Octopus in a way which causes the memory problem.
- Get another snapshot using the same command as before.
- Zip the dotMemory Workspaces, the Octopus Server logs, Task Logs for tasks running during that period of time, and server metrics or a performance chart covering that period in time.
- Upload the zip file bundle to the secure and private share which should have been provided by an Octopus team member, then get back in touch with us - unfortunately we don’t get notified of file uploads.
Start Octopus Server with dotMemory (alternative method)
If you can easily restart your Octopus Server, and the problem you are experiencing is reproducible, you can start Octopus Server with dotMemory for a better result. Starting Octopus Server with dotMemory means it can record the source of the memory allocations and help us track down the root cause of any memory leaks.
- Download the JetBrains dotMemory application and install it on the machine hosting Octopus Server.
- Start dotMemory as an Administrator and start a free trial (the trial can be paused afterwards).
- Stop the Octopus Deploy Windows service.
- Configure dotMemory to start your Octopus Server Windows service.
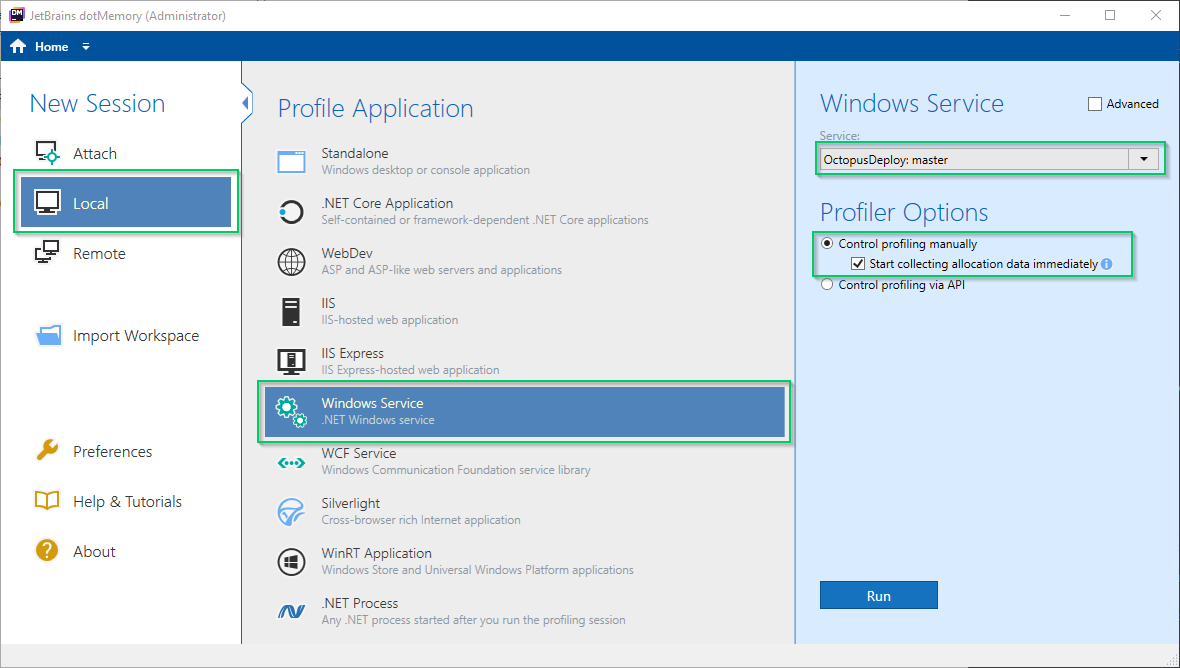 .
. - If everything is working as expected you should see a screen like the one shown below
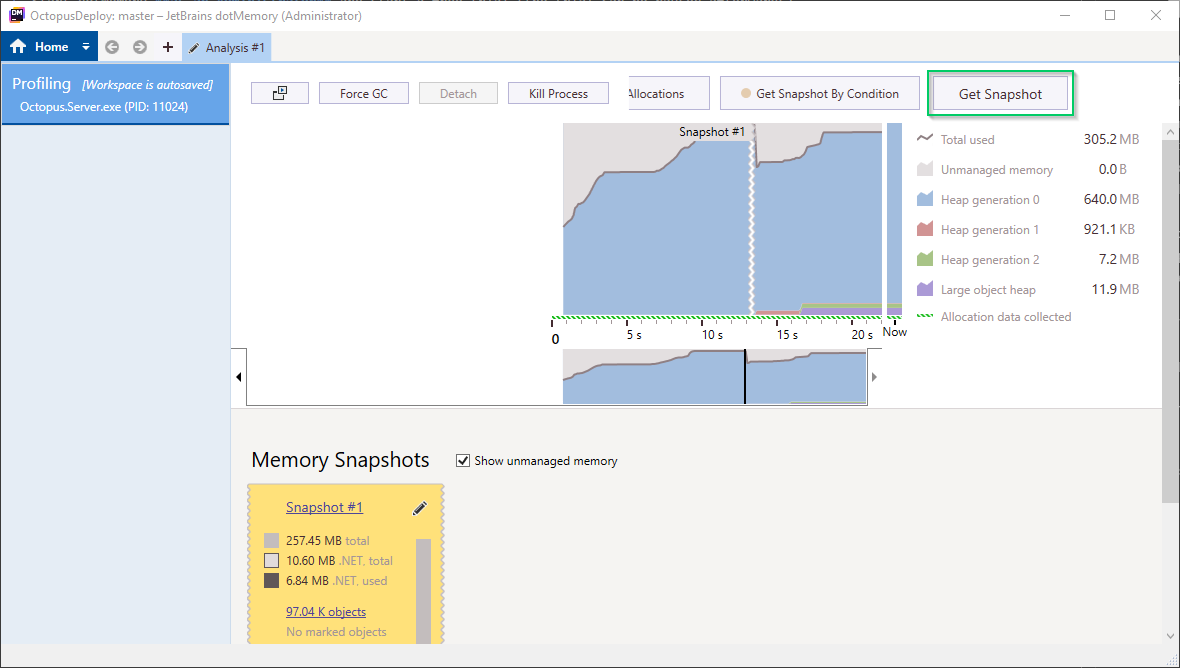 .
. - Take a snapshot just after the Octopus Server has started.
- Use Octopus in a way which causes the memory problem.
- Take another snapshot.
- Once it is safe, stop the Octopus Server process using dotMemory.
- Start your Octopus Server normally again.
- Export the dotMemory Workspace so you can share it with us.
- Close dotMemory.
- Zip the exported dotMemory Workspace, the Octopus Server logs, Task Logs for tasks running during that period of time, and server metrics or a performance chart covering that period in time.
- Upload the zip file bundle to the secure and private share which should have been provided by an Octopus team member, then get back in touch with us - unfortunately we don’t get notified of file uploads.
Analysis
Due to the nature and depth of these investigations it may take a little while to analyze the memory snapshots and get to the bottom of what’s happening.
DIY memory analysis
We ship debugging symbols (PDB) files in the box with Octopus Server. This means you can use the dotMemory tooling to do your own analysis and understand the root cause of any memory problems.
Help us continuously improve
Please let us know if you have any feedback about this page.
Page updated on Sunday, January 1, 2023