Octopus Server records OpenTelemetry (OTEL) traces that capture internal operations like HTTP requests, task execution, and more. These traces are saved as .tar files to disk and can be sent to Octopus support to help diagnose issues.
OpenTelemetry trace files are only available for self-hosted instances of Octopus Server.
This feature is available from 2026.1. It is disabled by default and can be enabled at Configuration ➜ Diagnostics.
Permissions
Viewing and changing the OpenTelemetry trace files configuration, and downloading or deleting trace files, requires the AdministerSystem permission.
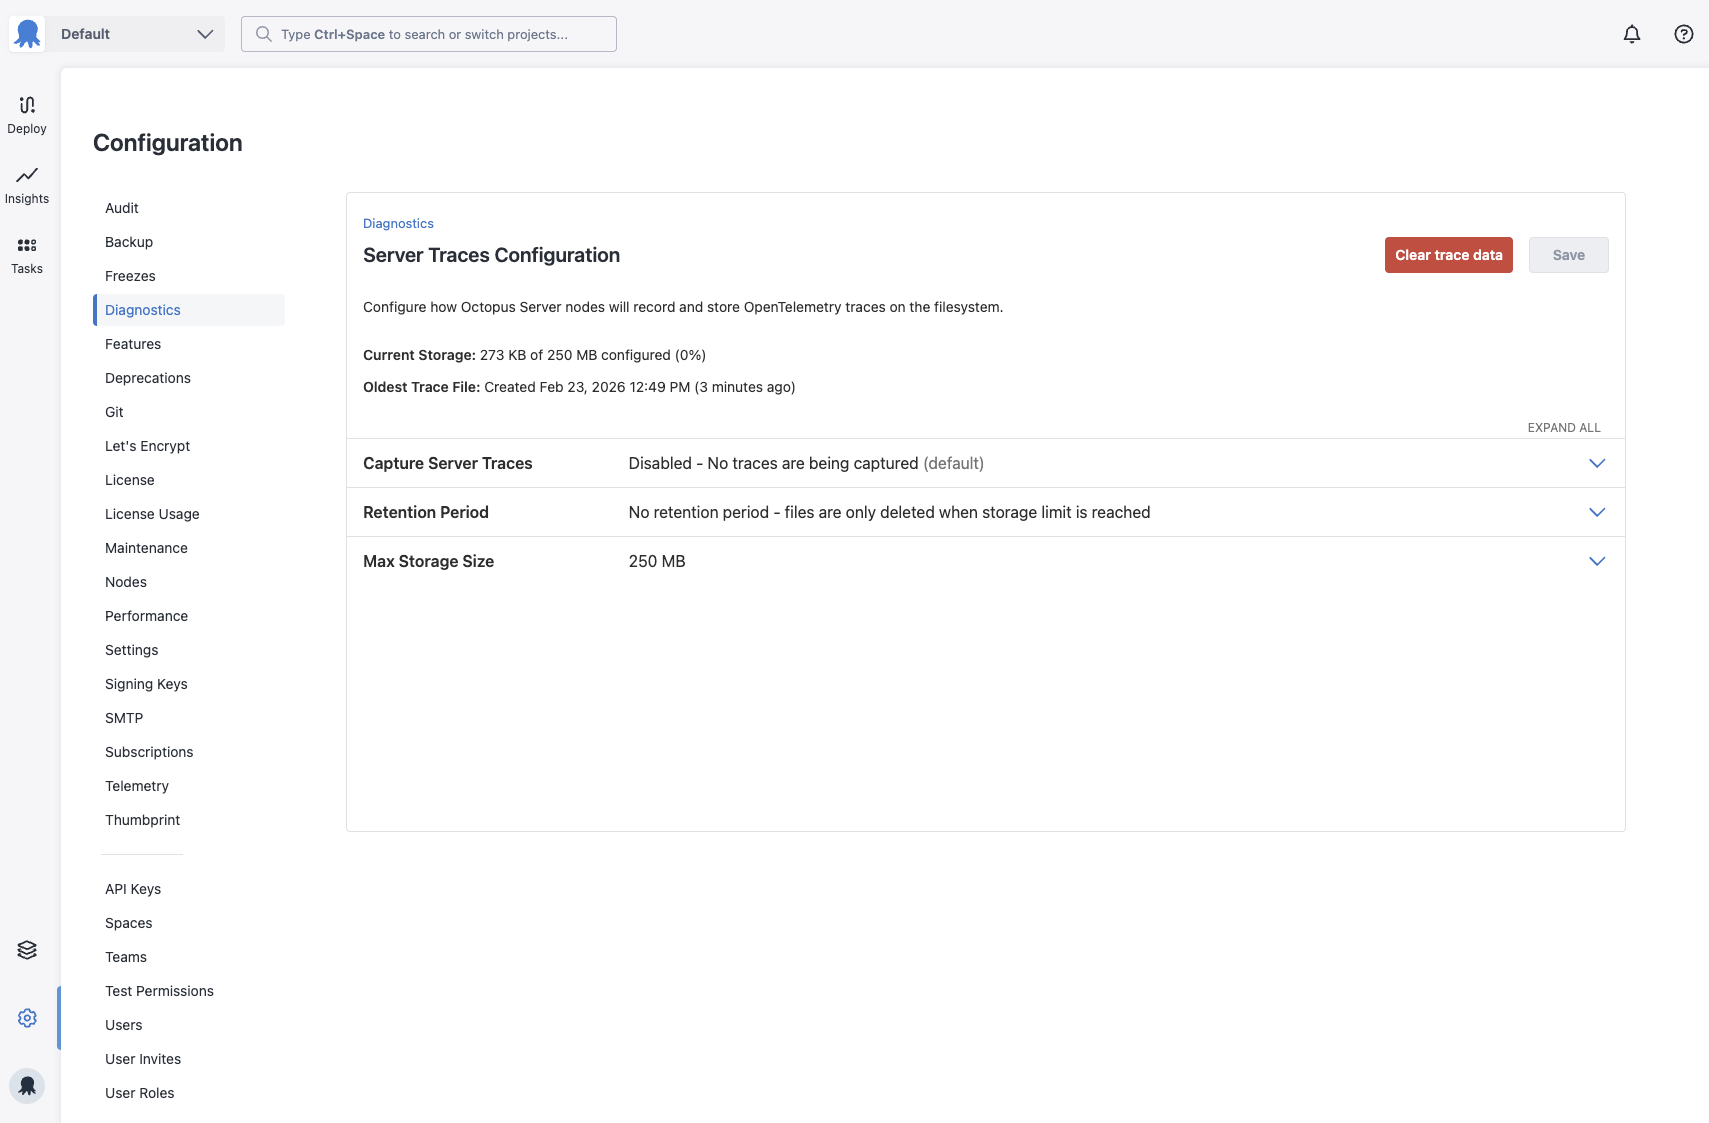
Enabling and configuring
- Navigate to Configuration ➜ Diagnostics.
- Under Server Traces, click
Configure. - Toggle Enabled.
- Optionally configure Max storage size and Retention days.
- Click
Save.
Configuration changes take effect within about 1 minute as the server syncs settings in the background.
What traces contain
Traces are made up of spans, each representing a unit of work performed by the server. The spans captured include:
- HTTP requests - inbound and outbound HTTP requests with timing and status information.
- Task execution - deployments, runbook runs, and other server tasks.
- Internal operations - other server-side work that provides context when diagnosing problems.
Each span includes attributes such as timing, status codes, and contextual metadata that help Octopus support engineers understand what the server was doing and where time was spent.
Trace data is stored in OTLP JSON format, which is compatible with the open source OpenTelemetry Collector after decompression.
File location
Trace files are stored under the Telemetry/OpenTelemetry/traces/ subdirectory of the server’s ClusterSharedDirectory as .tar files. ClusterSharedDirectory is the shared storage location Octopus uses for logs and diagnostics data - its path can be found at Configuration ➜ Settings ➜ Server Folders (or configured via the path command), and defaults to the server’s Home Directory if not explicitly set.
In a High Availability (HA) cluster, all nodes write to this shared path, so trace files from every node are available in one location.
Retention and disk usage
Traces are written to disk in 50 MB chunks. The configurable size limit controls how many of these chunk files will be written. When the total size approaches the configured size limit, the oldest trace files are deleted first to make room. The minimum configurable storage size is 250 MB.
Retention by age is unlimited by default, but you can configure a maximum number of days to keep trace files. Size-based and time-based retention work together - files are removed when they exceed either limit.
If a node crashes or restarts mid-write, any .tar.inprogress files left behind are automatically recovered after 10 minutes of inactivity and treated as completed trace files.
Downloading trace files
Trace files can be downloaded directly from the Diagnostics page:
- Navigate to Configuration ➜ Diagnostics.
- Under Server Traces, click
Downloadto save all current trace data as a single Zstandard compressed JSONL file.
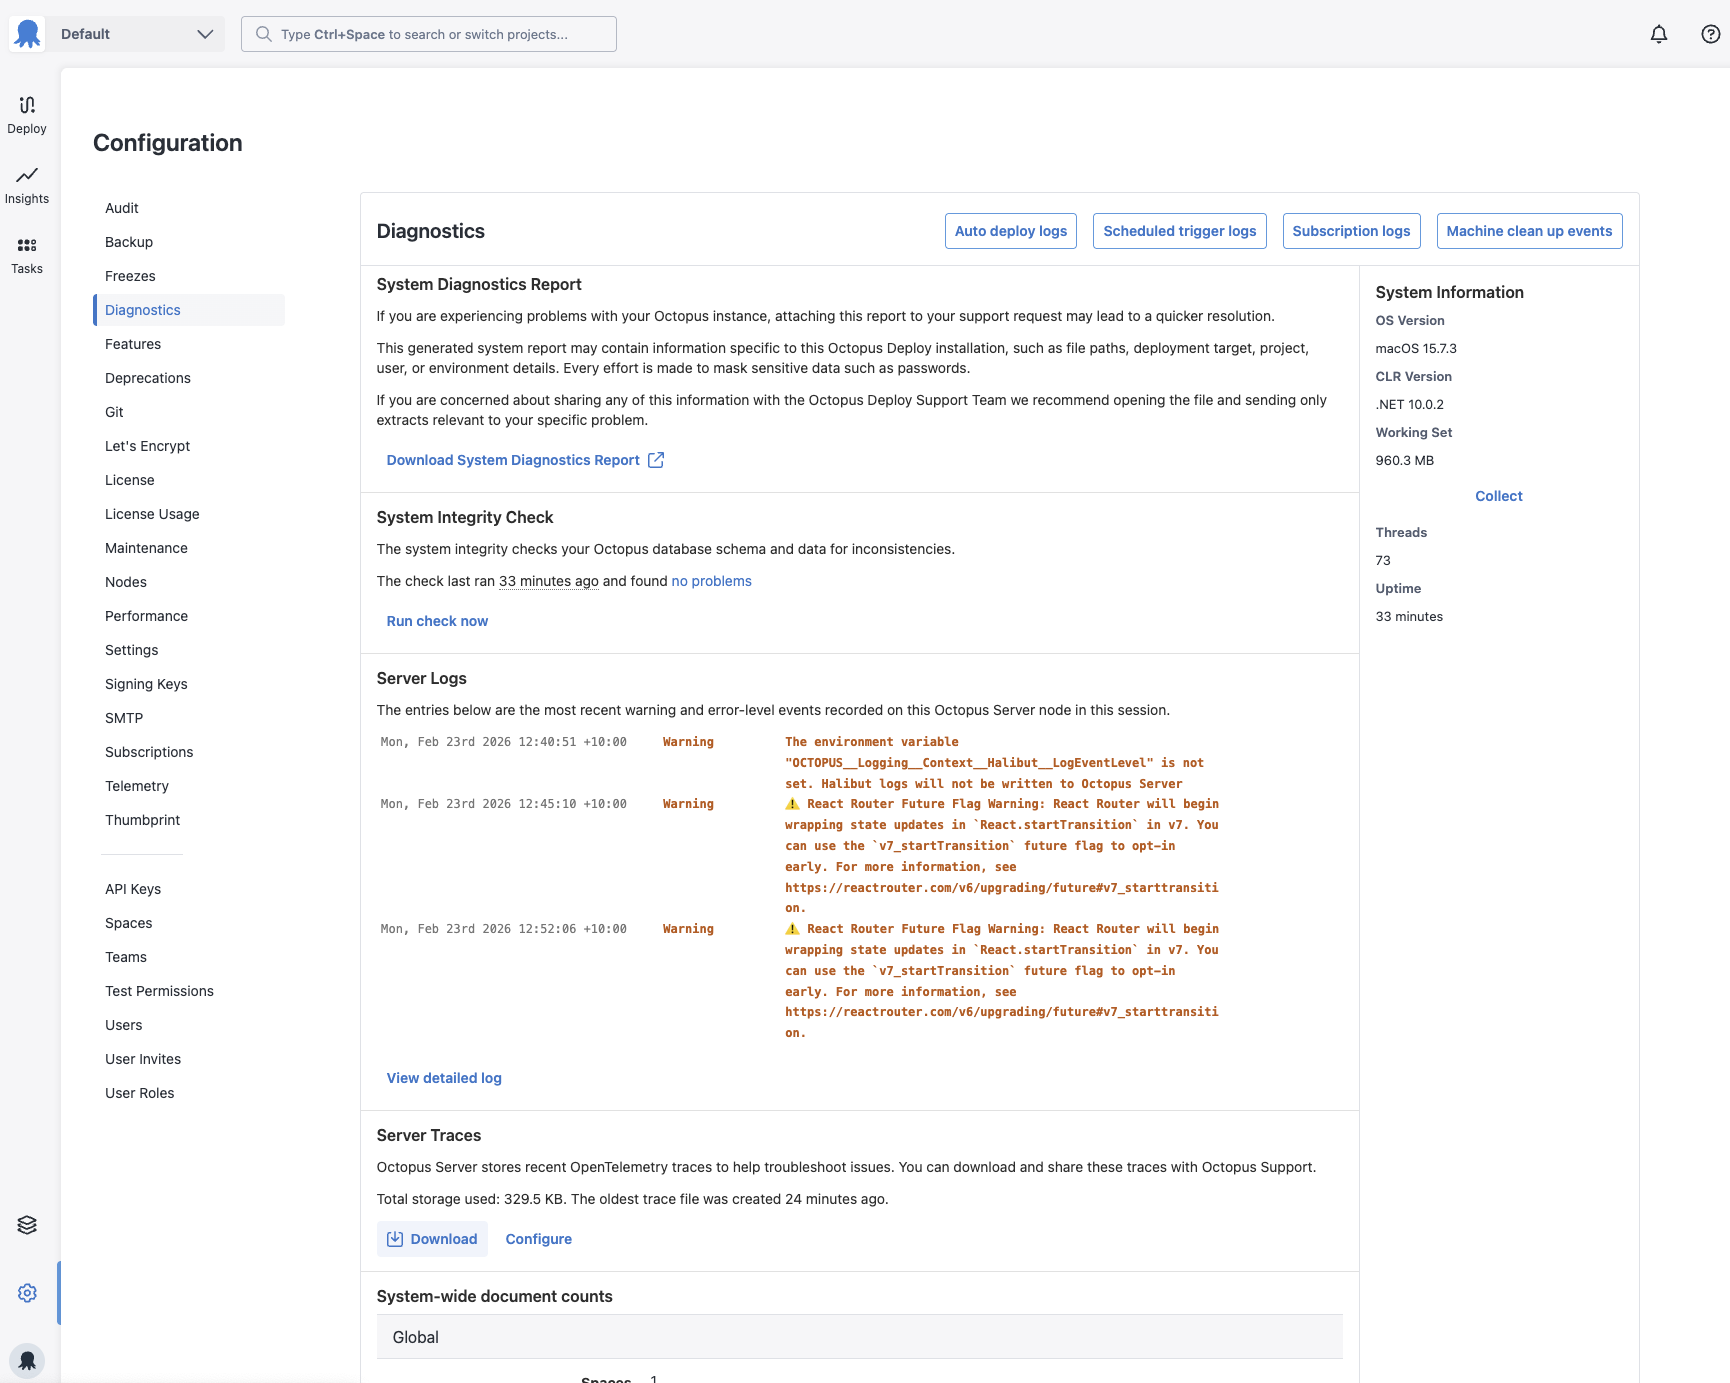
Downloading is available even while trace export is actively running - the download reads safely alongside the active writer.
Deleting trace files
To free disk space without waiting for retention limits to apply:
- Navigate to Configuration ➜ Diagnostics.
- Under Server Traces, click
Configure. - Disable the feature and click
Save. - Click the
Clear trace filesbutton.
Sending trace files to support
If Octopus support needs your trace files to help diagnose an issue, they will guide you through how to provide them.
Help us continuously improve
Please let us know if you have any feedback about this page.
Page updated on Tuesday, March 17, 2026